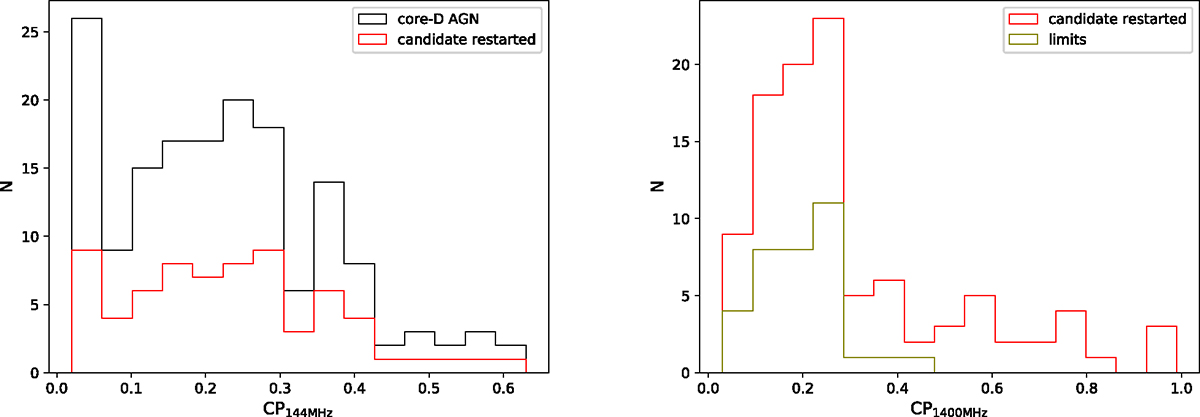
Fig. 3.
Download original image
Distribution of radio core prominence at 144 MHz and 1.4 GHz. Left panel: The distribution of the radio core prominence at 144 MHz, CP144 of the core-D AGNs sample, and the final sample of 69 candidate restarted galaxies as discussed in Sect. 3.5. The CP144 was estimated using the peak core flux densities measured directly from the LOFAR 6″ image and the total flux densities measured from the LOFAR 18″ image. We note that J105922.02+523902.1 with CP144 = 5.0 is excluded in this plot for illustration purposes. However, this source is identified as a broad line AGNs in Sect. 3.4 and excluded from the final sample of candidate restarted galaxies presented in Sect. 3.5. Right panel: The distribution of the radio core prominence at 1.4 GHz, CP1400 of the final sample of 69 candidate restarted galaxies as discussed in Sect. 3.5. The distribution of limits (63 upper and six lower limits) is shown in olive color (see text for details). The mean and median values of the CP distribution are 0.35 and 0.26 respectively. We note that the candidate restarted galaxies selected based on steep spectrum core (SSC), inverted spectrum core (ISC), and ultra-steep spectrum (USS) of extended emission presented in Sect. 3.5 are also included in both plots.
Current usage metrics show cumulative count of Article Views (full-text article views including HTML views, PDF and ePub downloads, according to the available data) and Abstracts Views on Vision4Press platform.
Data correspond to usage on the plateform after 2015. The current usage metrics is available 48-96 hours after online publication and is updated daily on week days.
Initial download of the metrics may take a while.