Fig. 5.
Download original image
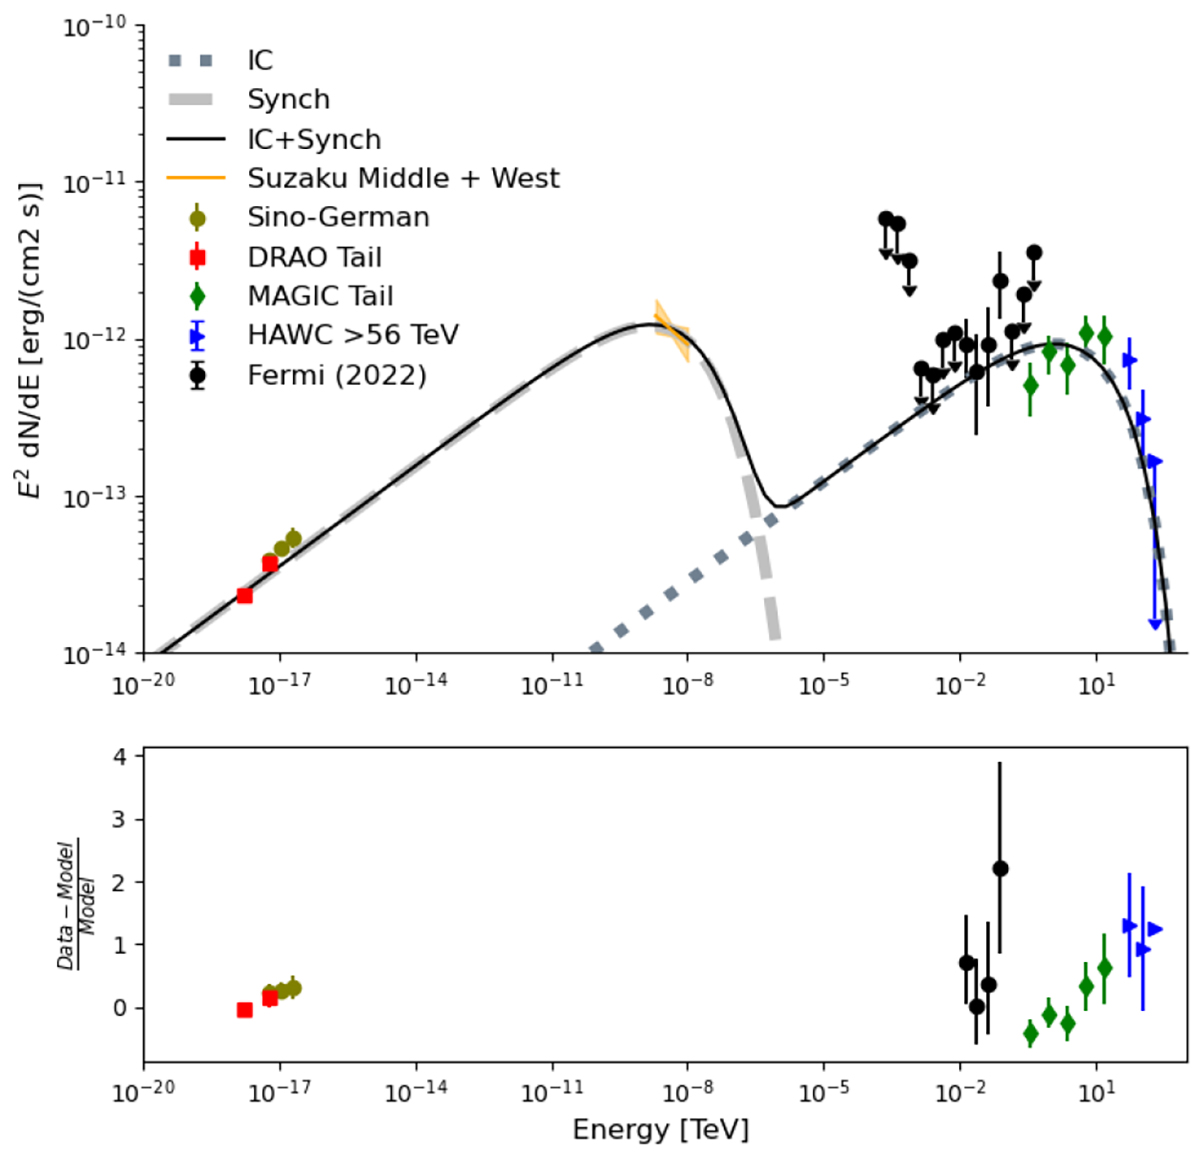
Top: multi-wavelength SED. The data shown includes the DRAO flux points in red squares (Pineault & Joncas 2000), the Sino-German and Effelsberg measurements in dark green circles (Gao et al. 2011), the Suzaku spectrum in yellow (Ge et al. 2021), the Fermi-LAT flux points in black dots (Fang et al. 2022), the MAGIC flux points in green diamonds (MAGIC Collaboration 2023), and the HAWC flux points from the VHE work in blue triangles. Synchrotron is shown in dashed light grey, IC scattering is shown in dotted dark grey, and black shows the total SED from synchrotron and IC scattering combined. Bottom: offset between the data points used and the model determined with Naima. The Fermi-LAT upper limits are removed to better see the deviation about zero for the other data points.
Current usage metrics show cumulative count of Article Views (full-text article views including HTML views, PDF and ePub downloads, according to the available data) and Abstracts Views on Vision4Press platform.
Data correspond to usage on the plateform after 2015. The current usage metrics is available 48-96 hours after online publication and is updated daily on week days.
Initial download of the metrics may take a while.