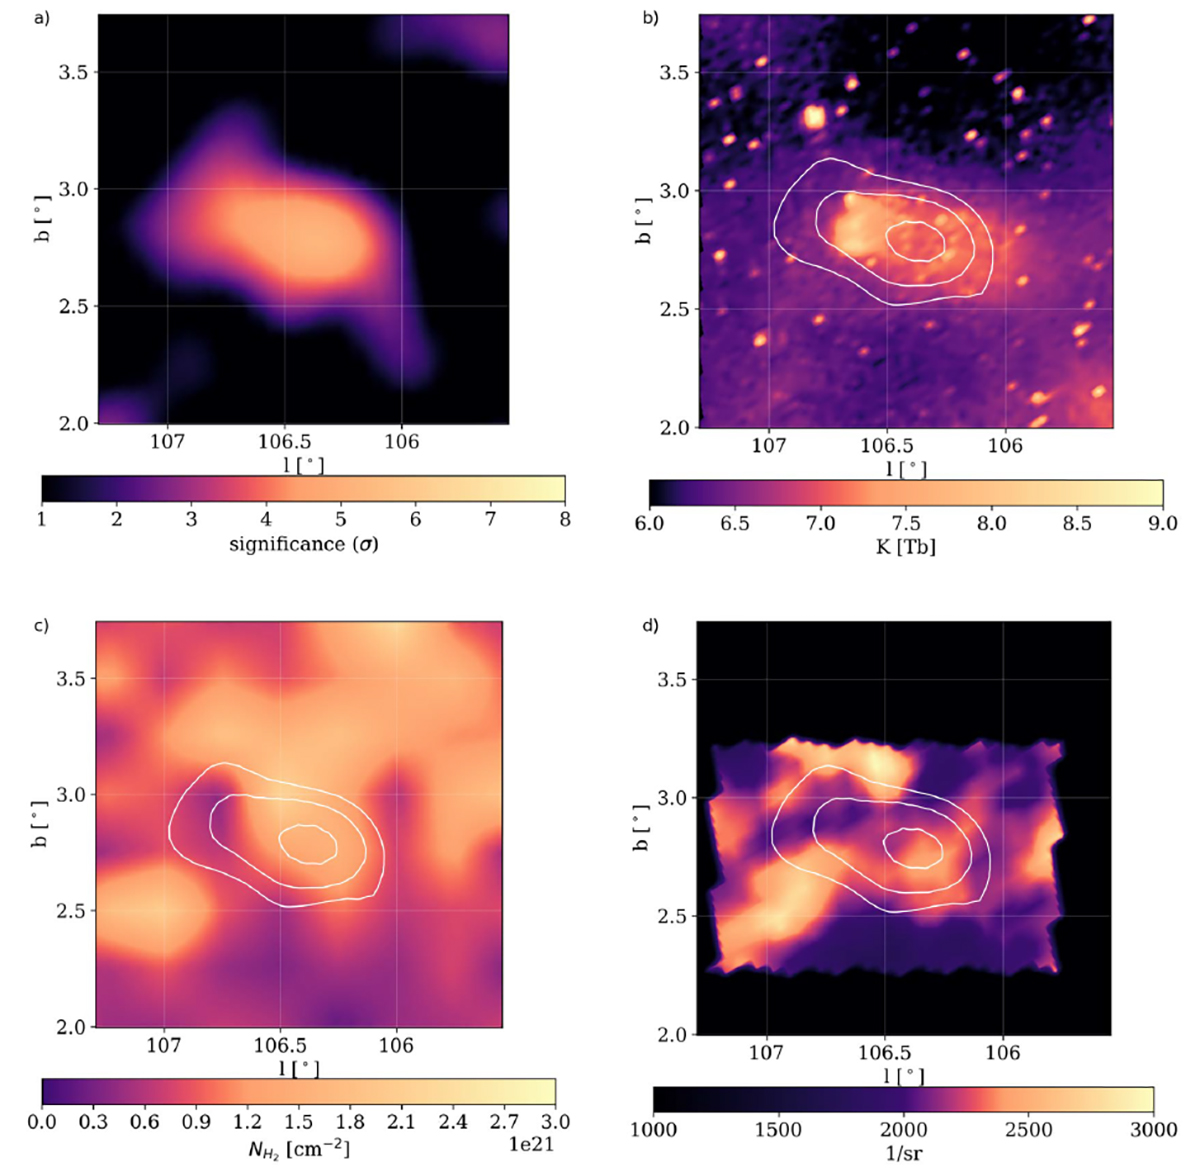
Fig. 4.
Download original image
Significance maps for HAWC’s > 56 TeV emission and its comparison to the SNR and molecular clouds in the region. a) The HAWC significance map of the region above 56 TeV. b) The brightness temperature image (Taylor et al. 2003) of the SNR overlaid with the HAWC 3, 4, and 5σ contours in white. c) Molecular hydrogen column density integrated over a velocity range of −20 km/s to 0 km/s (Dame et al. 2001). d) The Planck 353 GHz template normalized to 1/sr that is used in the UHE HAWC fit.
Current usage metrics show cumulative count of Article Views (full-text article views including HTML views, PDF and ePub downloads, according to the available data) and Abstracts Views on Vision4Press platform.
Data correspond to usage on the plateform after 2015. The current usage metrics is available 48-96 hours after online publication and is updated daily on week days.
Initial download of the metrics may take a while.