Fig. 2.
Download original image
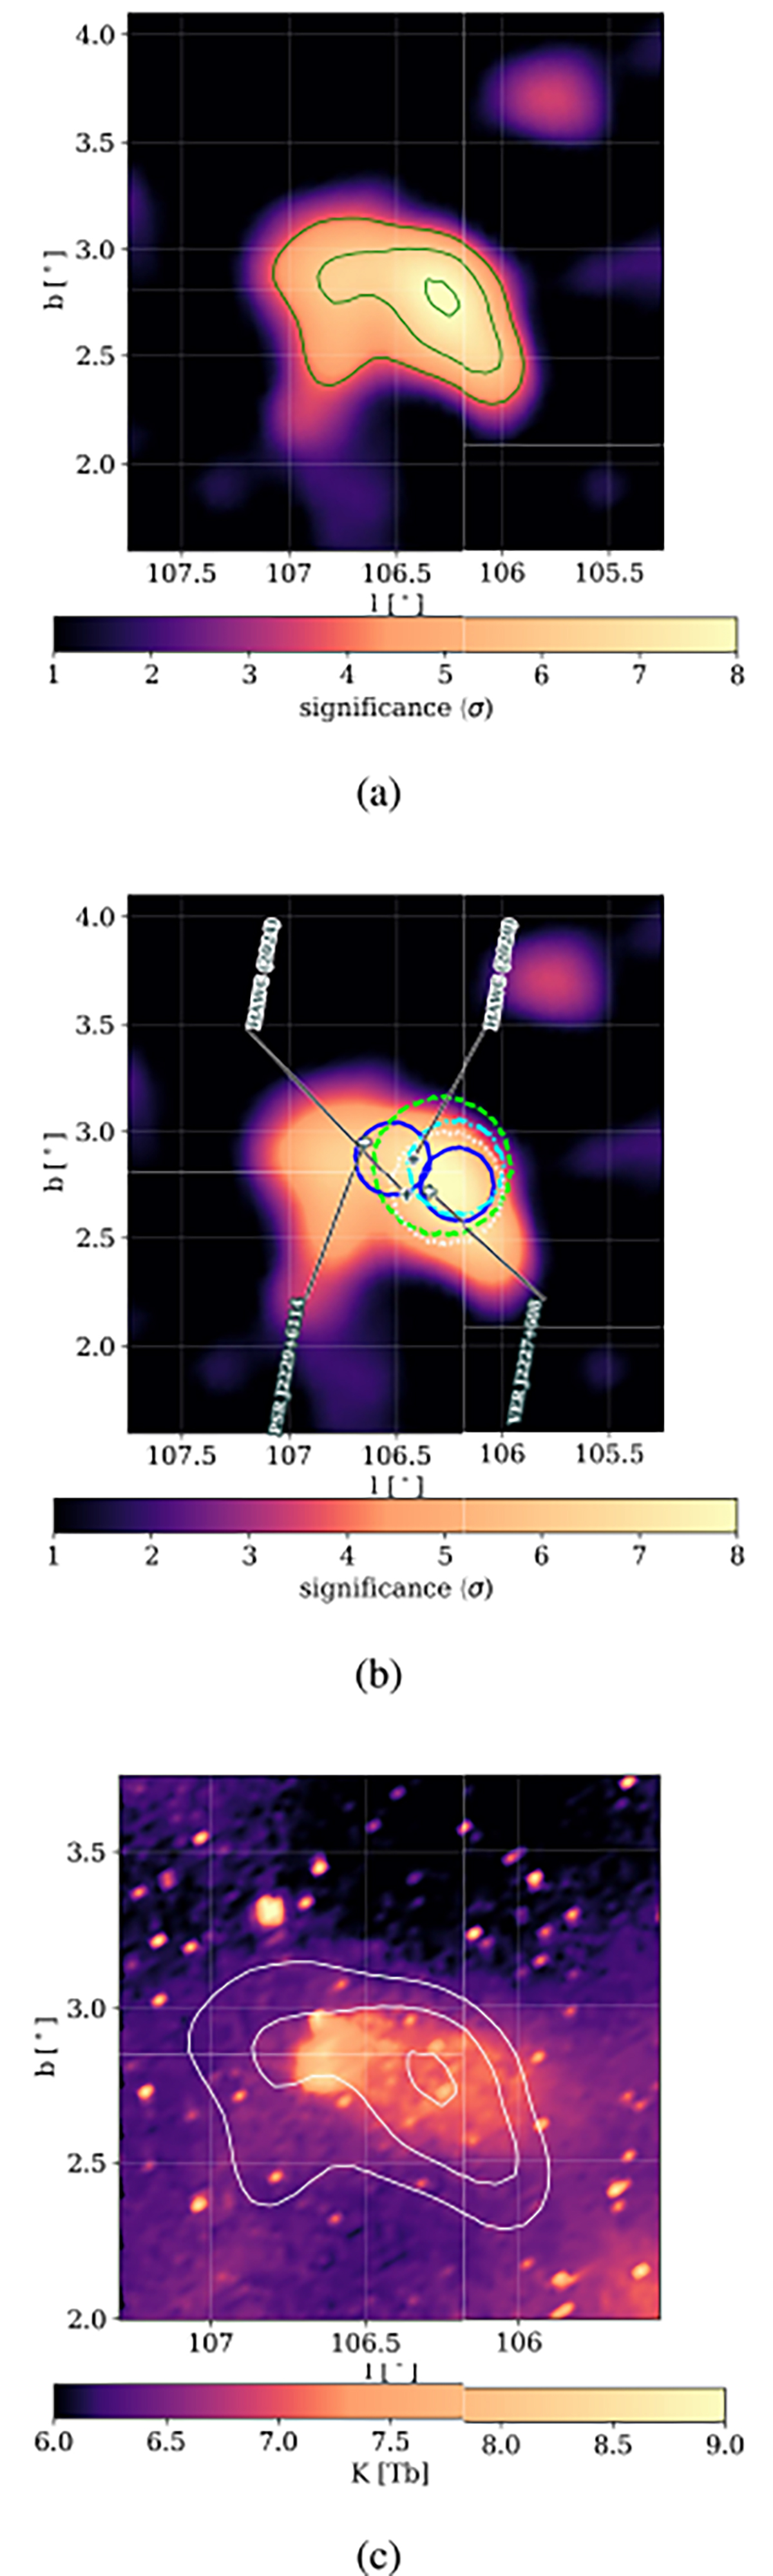
Significance maps for HAWC’s all-energy emission and its comparison to the SNR in the region. a) The HAWC all-energy significance map of the region with the 4, 6, and 8σ contours overlaid in green. b) The HAWC significance map of the region with labels showing the best-fit positions from this analysis, the previous HAWC publication (Albert et al. 2020), and VERITAS (Acciari et al. 2009). The green dashed, white dotted, cyan dot-dashed, and blue solid contour indicate LHAASO’s analysis region (Cao et al. 2021), Tibet ASγ’s 1σ extension (Amenomori et al. 2021), Fermi-LAT’s 1σ extension (Fang et al. 2022), and MAGIC’s analysis regions (MAGIC Collaboration 2023), respectively. c) The brightness temperature image (Taylor et al. 2003) of the SNR overlaid with the HAWC 4, 6, and 8σ contours in white. The bright emission on the left shows the head of the SNR, while the faint emission extending to the right shows the tail.
Current usage metrics show cumulative count of Article Views (full-text article views including HTML views, PDF and ePub downloads, according to the available data) and Abstracts Views on Vision4Press platform.
Data correspond to usage on the plateform after 2015. The current usage metrics is available 48-96 hours after online publication and is updated daily on week days.
Initial download of the metrics may take a while.