Open Access
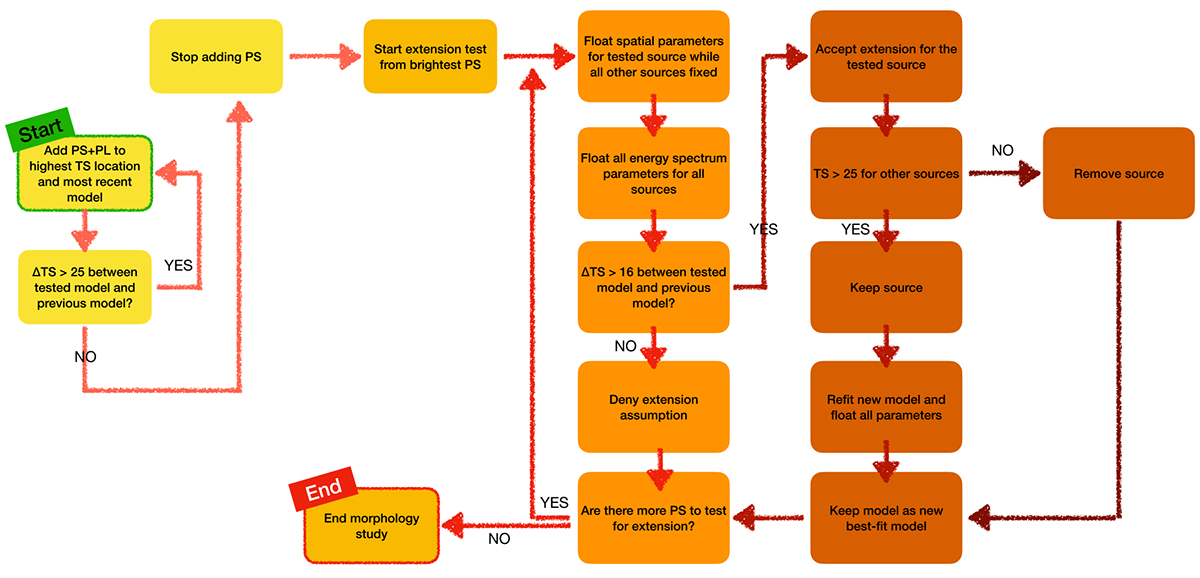
Fig. 1.
Download original image
Diagram of the multi-source search method described in Section 3. Yellow boxes (first two columns) describe how point sources (PSs) are added, where PL refers to a power-law spectrum. Orange/red boxes (last four columns) describe how extended sources are added.
Current usage metrics show cumulative count of Article Views (full-text article views including HTML views, PDF and ePub downloads, according to the available data) and Abstracts Views on Vision4Press platform.
Data correspond to usage on the plateform after 2015. The current usage metrics is available 48-96 hours after online publication and is updated daily on week days.
Initial download of the metrics may take a while.