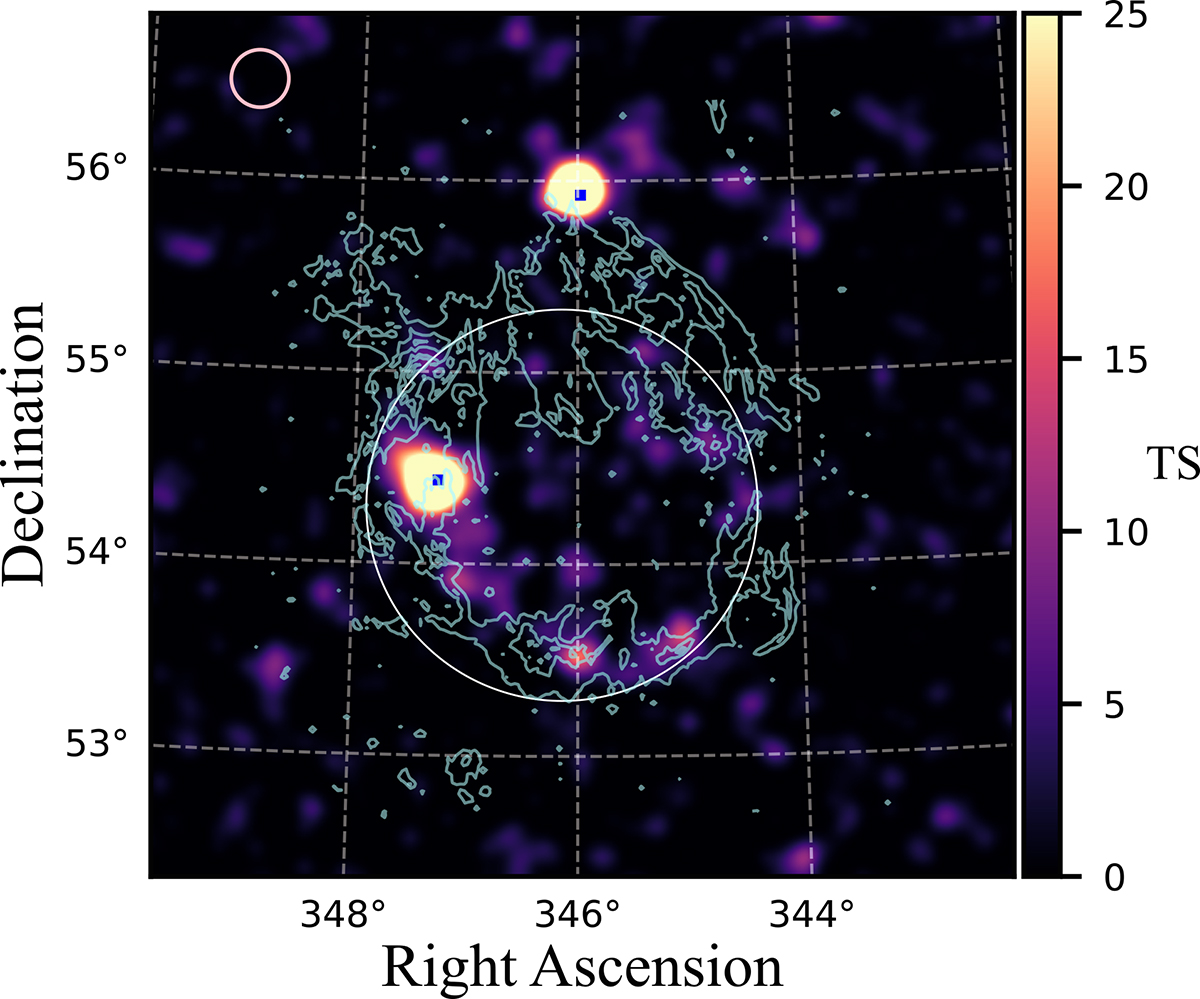
Fig. B.1.
Download original image
A TS map above 10 GeV obtained after removing the SNR and the sources 4FGL J2309.0 + 5425 and 4FGL J2303.9 + 5554 from the model (thus causing them to appear in the map). The large circle indicates the gamma-ray disk model for the SNR (whose optical contours are shown) and the squares are the catalogued positions of the 4FGL sources. The upper-left circle indicates the 68%-containment region of the LAT point spread function for both front- and back-converted events at 10 GeV.
Current usage metrics show cumulative count of Article Views (full-text article views including HTML views, PDF and ePub downloads, according to the available data) and Abstracts Views on Vision4Press platform.
Data correspond to usage on the plateform after 2015. The current usage metrics is available 48-96 hours after online publication and is updated daily on week days.
Initial download of the metrics may take a while.