Open Access
Fig. A.1.
Download original image
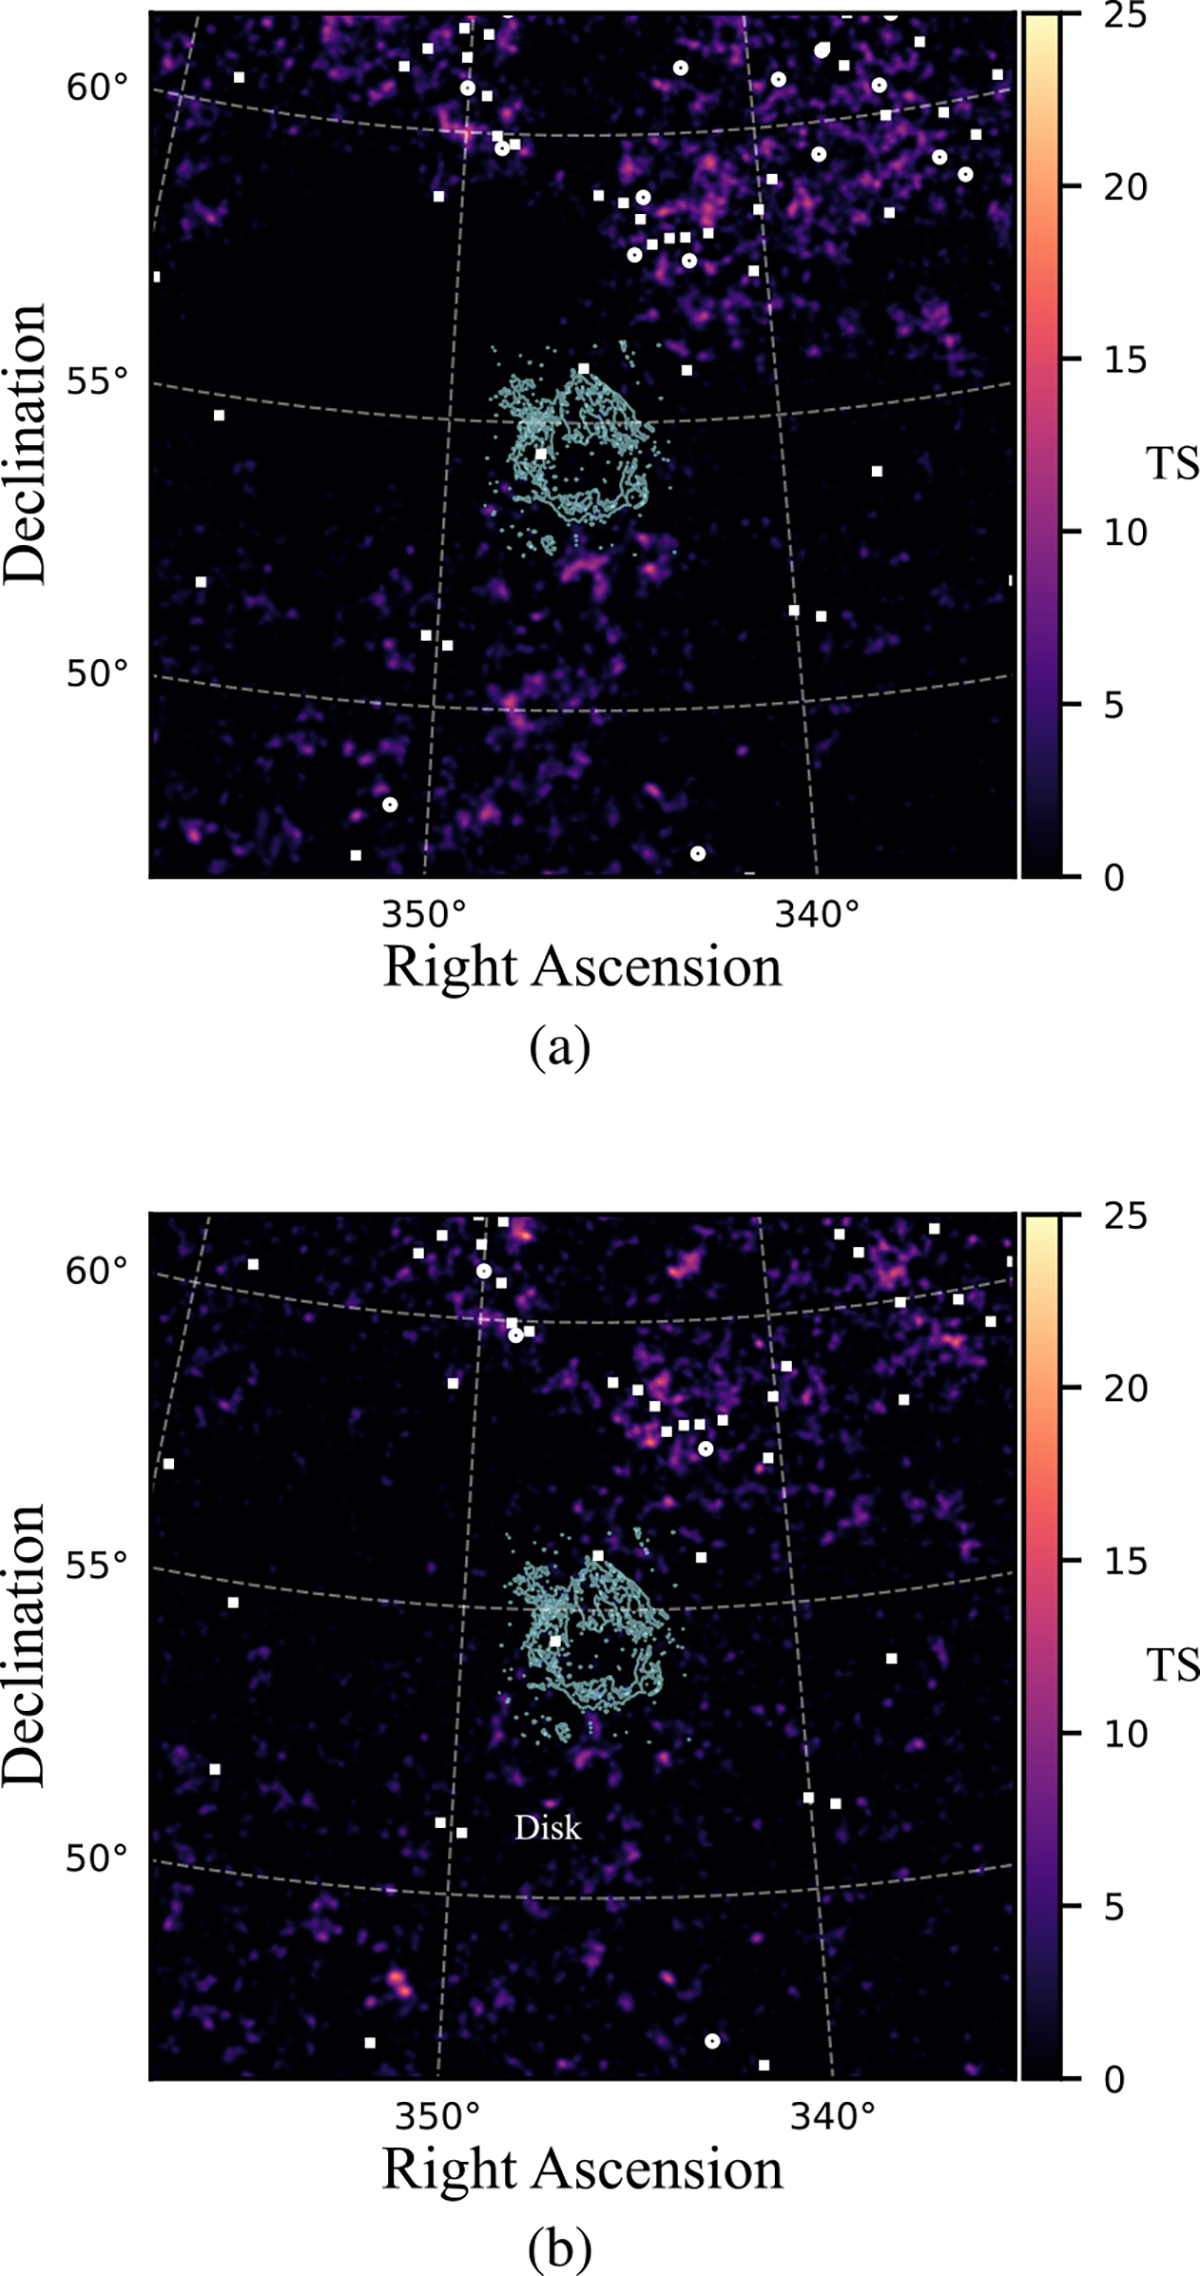
Residual TS maps obtained after subtracting all the background 4FGL sources (squares), additional excess emission modeled as point sources in this work (circles) and the SNR G107.7−5.1, in two analysis intervals: 0.1–500 GeV (a) and 2–500 GeV (b). The contours represent the optical emission from the SNR shell.
Current usage metrics show cumulative count of Article Views (full-text article views including HTML views, PDF and ePub downloads, according to the available data) and Abstracts Views on Vision4Press platform.
Data correspond to usage on the plateform after 2015. The current usage metrics is available 48-96 hours after online publication and is updated daily on week days.
Initial download of the metrics may take a while.