Open Access
Fig. 2.
Download original image
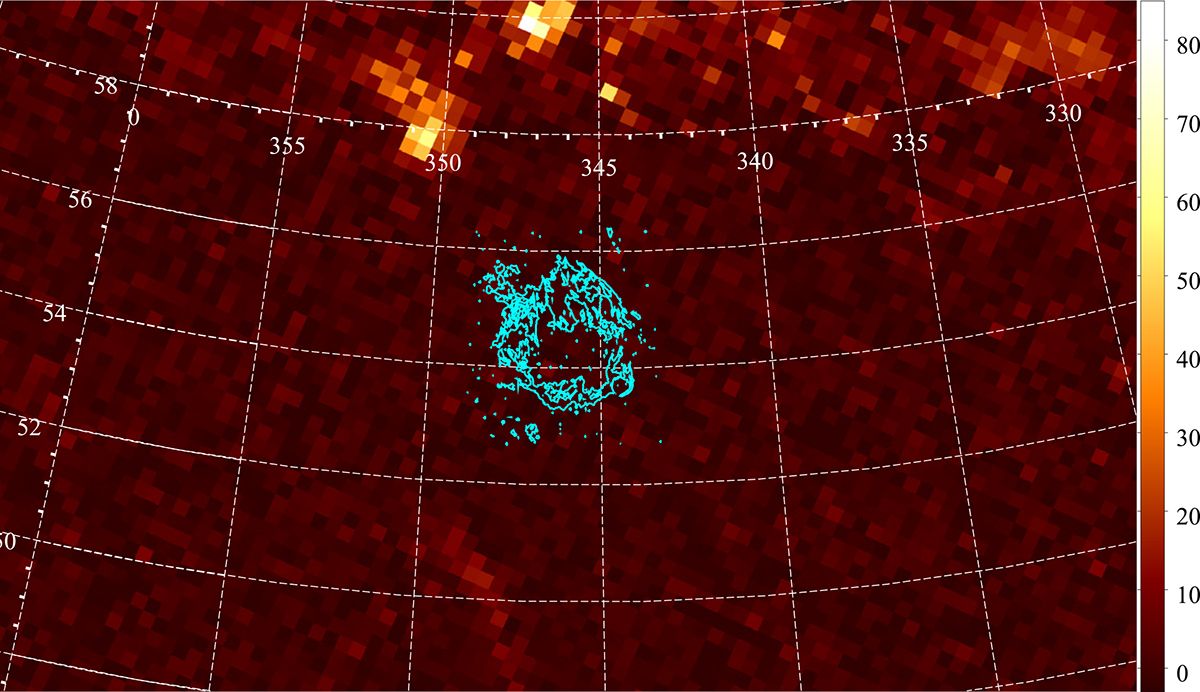
Velocity-integrated CO (J = 1 − 0) emission line from Dame et al. (2001) with the optical contours of the SNR overlaid (cyan, same as Fig. 1). Map units are K km s−1 and grid coordinates are RA and Dec (°).
Current usage metrics show cumulative count of Article Views (full-text article views including HTML views, PDF and ePub downloads, according to the available data) and Abstracts Views on Vision4Press platform.
Data correspond to usage on the plateform after 2015. The current usage metrics is available 48-96 hours after online publication and is updated daily on week days.
Initial download of the metrics may take a while.