Fig. 1.
Download original image
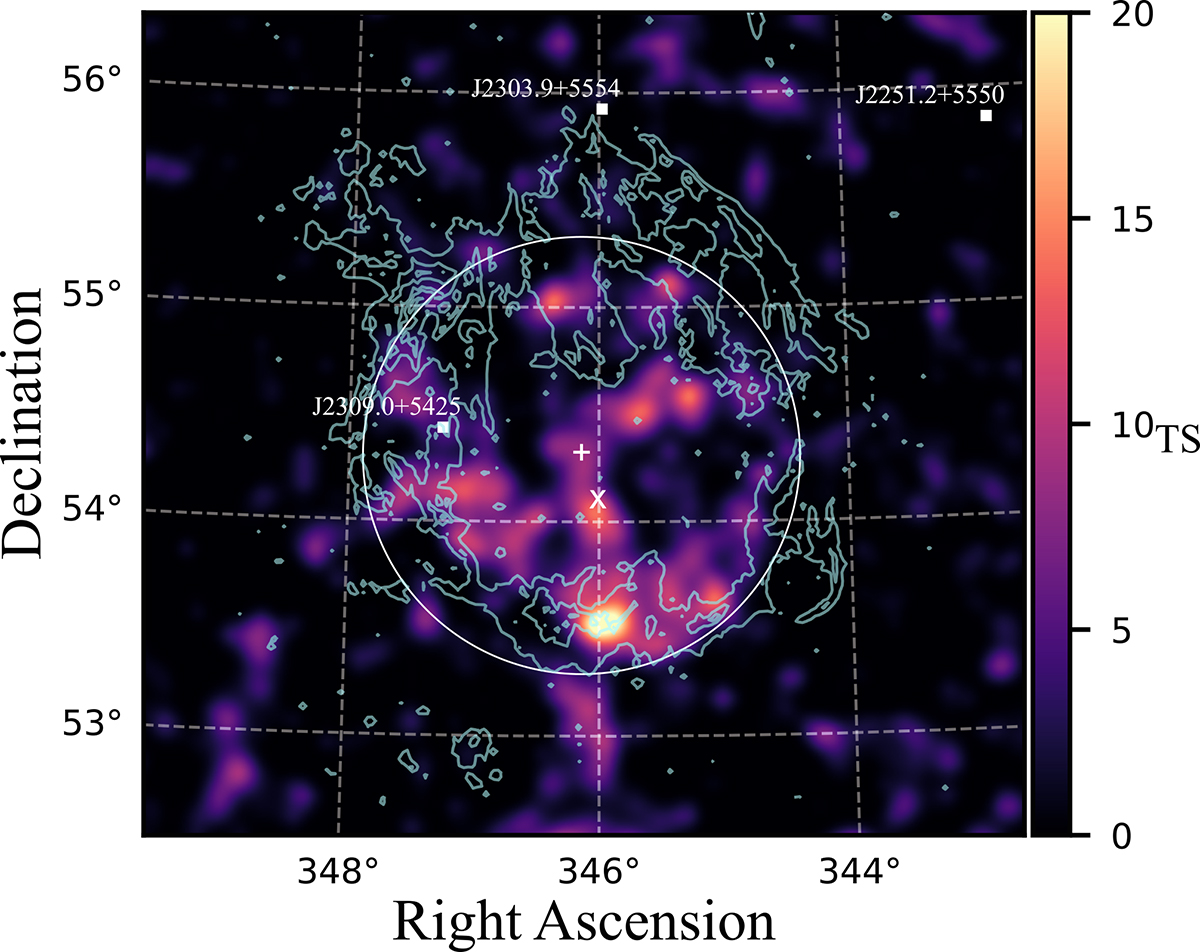
TS map for events with energies above 2 GeV showing the emission from G107.7−5.1. The circle represents the uniform disk obtained in this work to model the morphology of the gamma-ray emission. The contours show the optical emission of the SNR shell taken from Fesen et al. (2024). The marks + and × indicate the center locations of the disk and the extended 4FGL source, respectively, while the boxes show the locations of the other 4FGL-DR4 sources in the region.
Current usage metrics show cumulative count of Article Views (full-text article views including HTML views, PDF and ePub downloads, according to the available data) and Abstracts Views on Vision4Press platform.
Data correspond to usage on the plateform after 2015. The current usage metrics is available 48-96 hours after online publication and is updated daily on week days.
Initial download of the metrics may take a while.