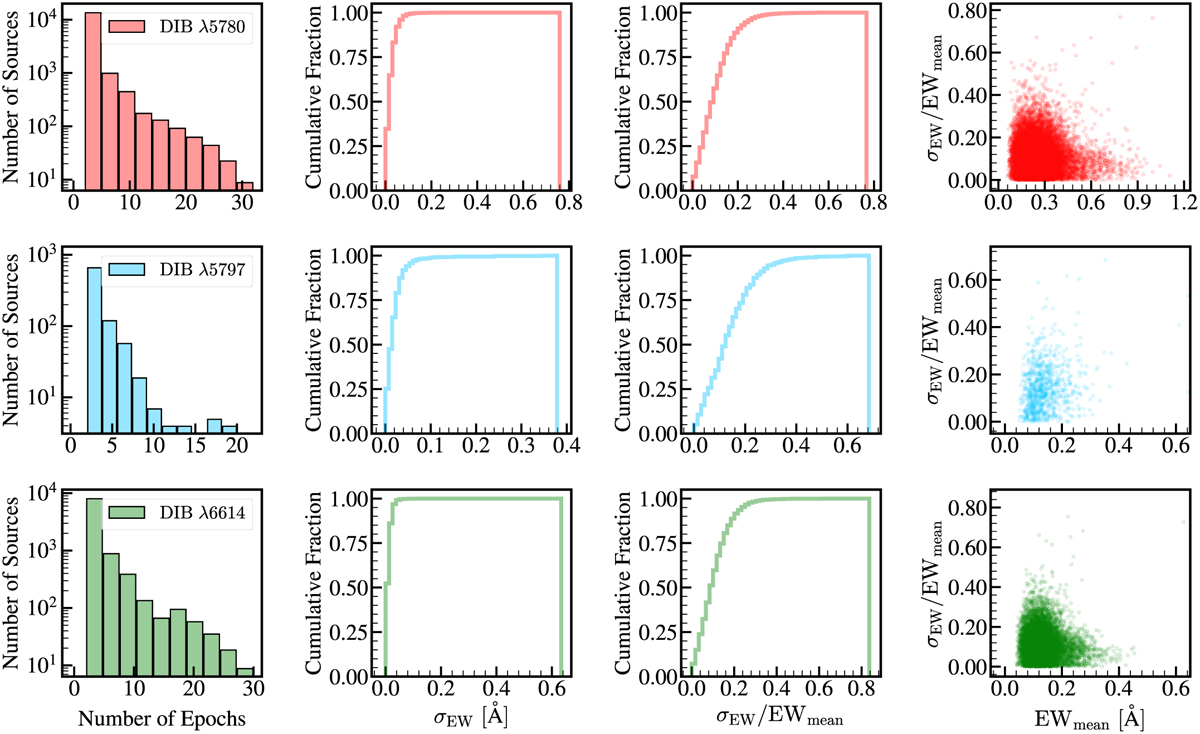
Fig. 7
Download original image
Three distinct colors encode the three DIBs λ5780, λ5797, and λ6614 for the HQ samples with over two epochs. The panels in the first column present the distribution of the number of epochs. The panels in the second column depict the cumulative distribution of the standard deviation of the EWs (σEW). The panels in the third column display the cumulative distribution of the coefficient of variation (σEW/EWmean). The panels in the fourth column show the scatter of the σEW/EWmean as a function of the EWmean.
Current usage metrics show cumulative count of Article Views (full-text article views including HTML views, PDF and ePub downloads, according to the available data) and Abstracts Views on Vision4Press platform.
Data correspond to usage on the plateform after 2015. The current usage metrics is available 48-96 hours after online publication and is updated daily on week days.
Initial download of the metrics may take a while.