Fig. 6
Download original image
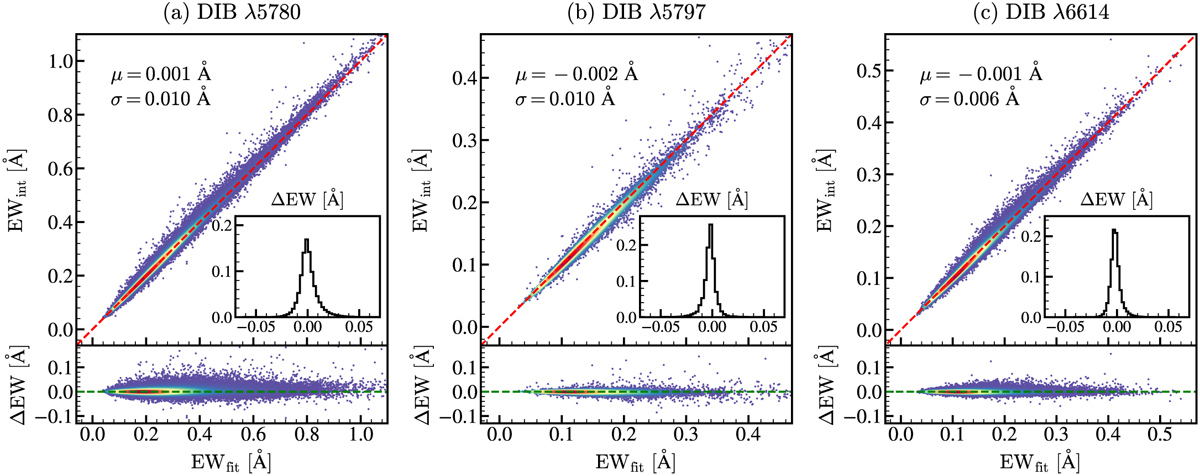
Comparison between the integral EW and the fitted EW of the DIBs λ15780, λ5797, and λ16614 for their HQ samples, from the subfigures (a) to (c). For each subfigure, the upper panel shows the Gaussian KDE number density plot of the integral EW as a function of the fitted EW, with the red dashed line representing the one-to-one relation. The lower panel displays the Gaussian KDE number density plot of the difference between the integral EW and the fitted EW, namely ∆EW = EWint − EWfit as a function of the fitted EW, with the green dashed line representing the zero benchmark. The distribution of ∆EW is also overplotted in the upper panel with its mean and standard deviation annotated.
Current usage metrics show cumulative count of Article Views (full-text article views including HTML views, PDF and ePub downloads, according to the available data) and Abstracts Views on Vision4Press platform.
Data correspond to usage on the plateform after 2015. The current usage metrics is available 48-96 hours after online publication and is updated daily on week days.
Initial download of the metrics may take a while.