Fig. 5
Download original image
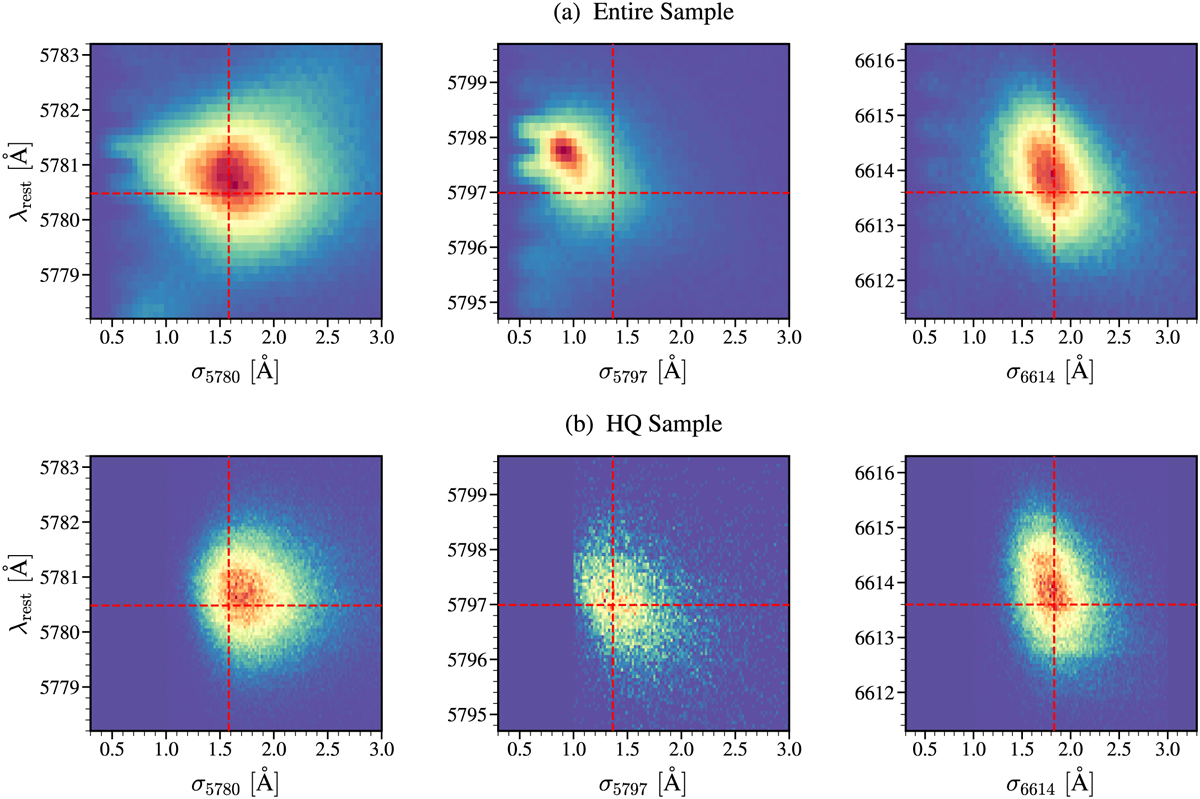
Two-dimensional histograms of the measured DIBs λ5780, λ5797, and λ6614 as a function of the Gaussian width σ and the central wavelength λ in the rest frame. (a) The three upper panels present the density of all the samples that may have DIBs, (b) and the other three lower panels show the density of the HQ samples for which we have reliable DIB measurements. All of the histograms have the same bin size of 100. The red horizontal dashed lines denote the central wavelengths of the DIBs, which are fitted using the method described in Sect. 5.3. The red vertical dashed lines indicate the typical Gaussian widths of the DIBs considering the instrumental broadening of LAMOST LRS (see Appendix A), which are taken from Vogrinčič et al. (2023).
Current usage metrics show cumulative count of Article Views (full-text article views including HTML views, PDF and ePub downloads, according to the available data) and Abstracts Views on Vision4Press platform.
Data correspond to usage on the plateform after 2015. The current usage metrics is available 48-96 hours after online publication and is updated daily on week days.
Initial download of the metrics may take a while.