Fig. 4
Download original image
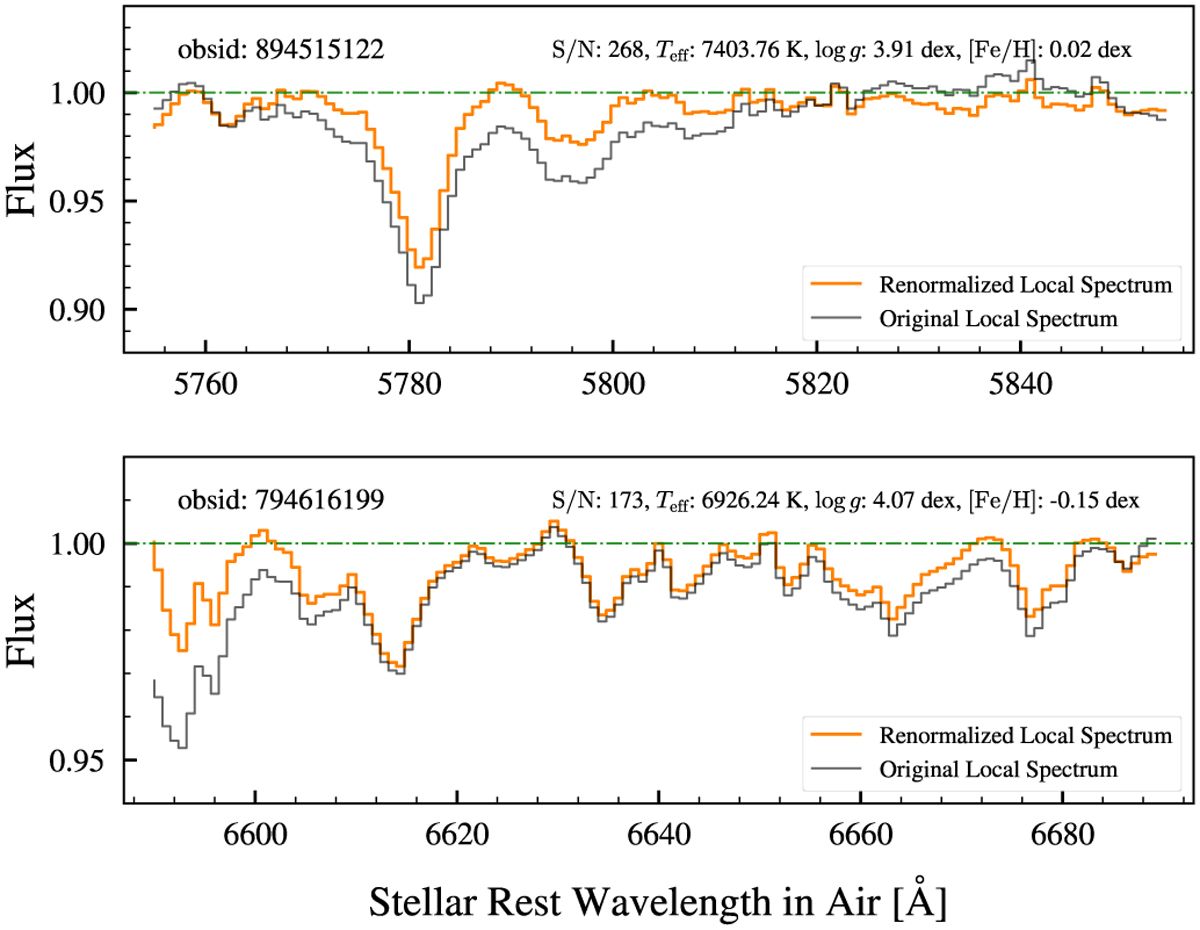
Examples of the local renormalization for two target spectra. The upper panel is the target spectrum within the local region covering the DIBs λ5780 and λ5797, and the lower panel is the target spectrum within the local region including the DIB λ6614. In each panel, the black line represents the original spectrum, and the orange line is the renormalized spectrum. The obsid of the target spectrum and its atmospheric parameters are also annotated in each panel.
Current usage metrics show cumulative count of Article Views (full-text article views including HTML views, PDF and ePub downloads, according to the available data) and Abstracts Views on Vision4Press platform.
Data correspond to usage on the plateform after 2015. The current usage metrics is available 48-96 hours after online publication and is updated daily on week days.
Initial download of the metrics may take a while.