Fig. 3
Download original image
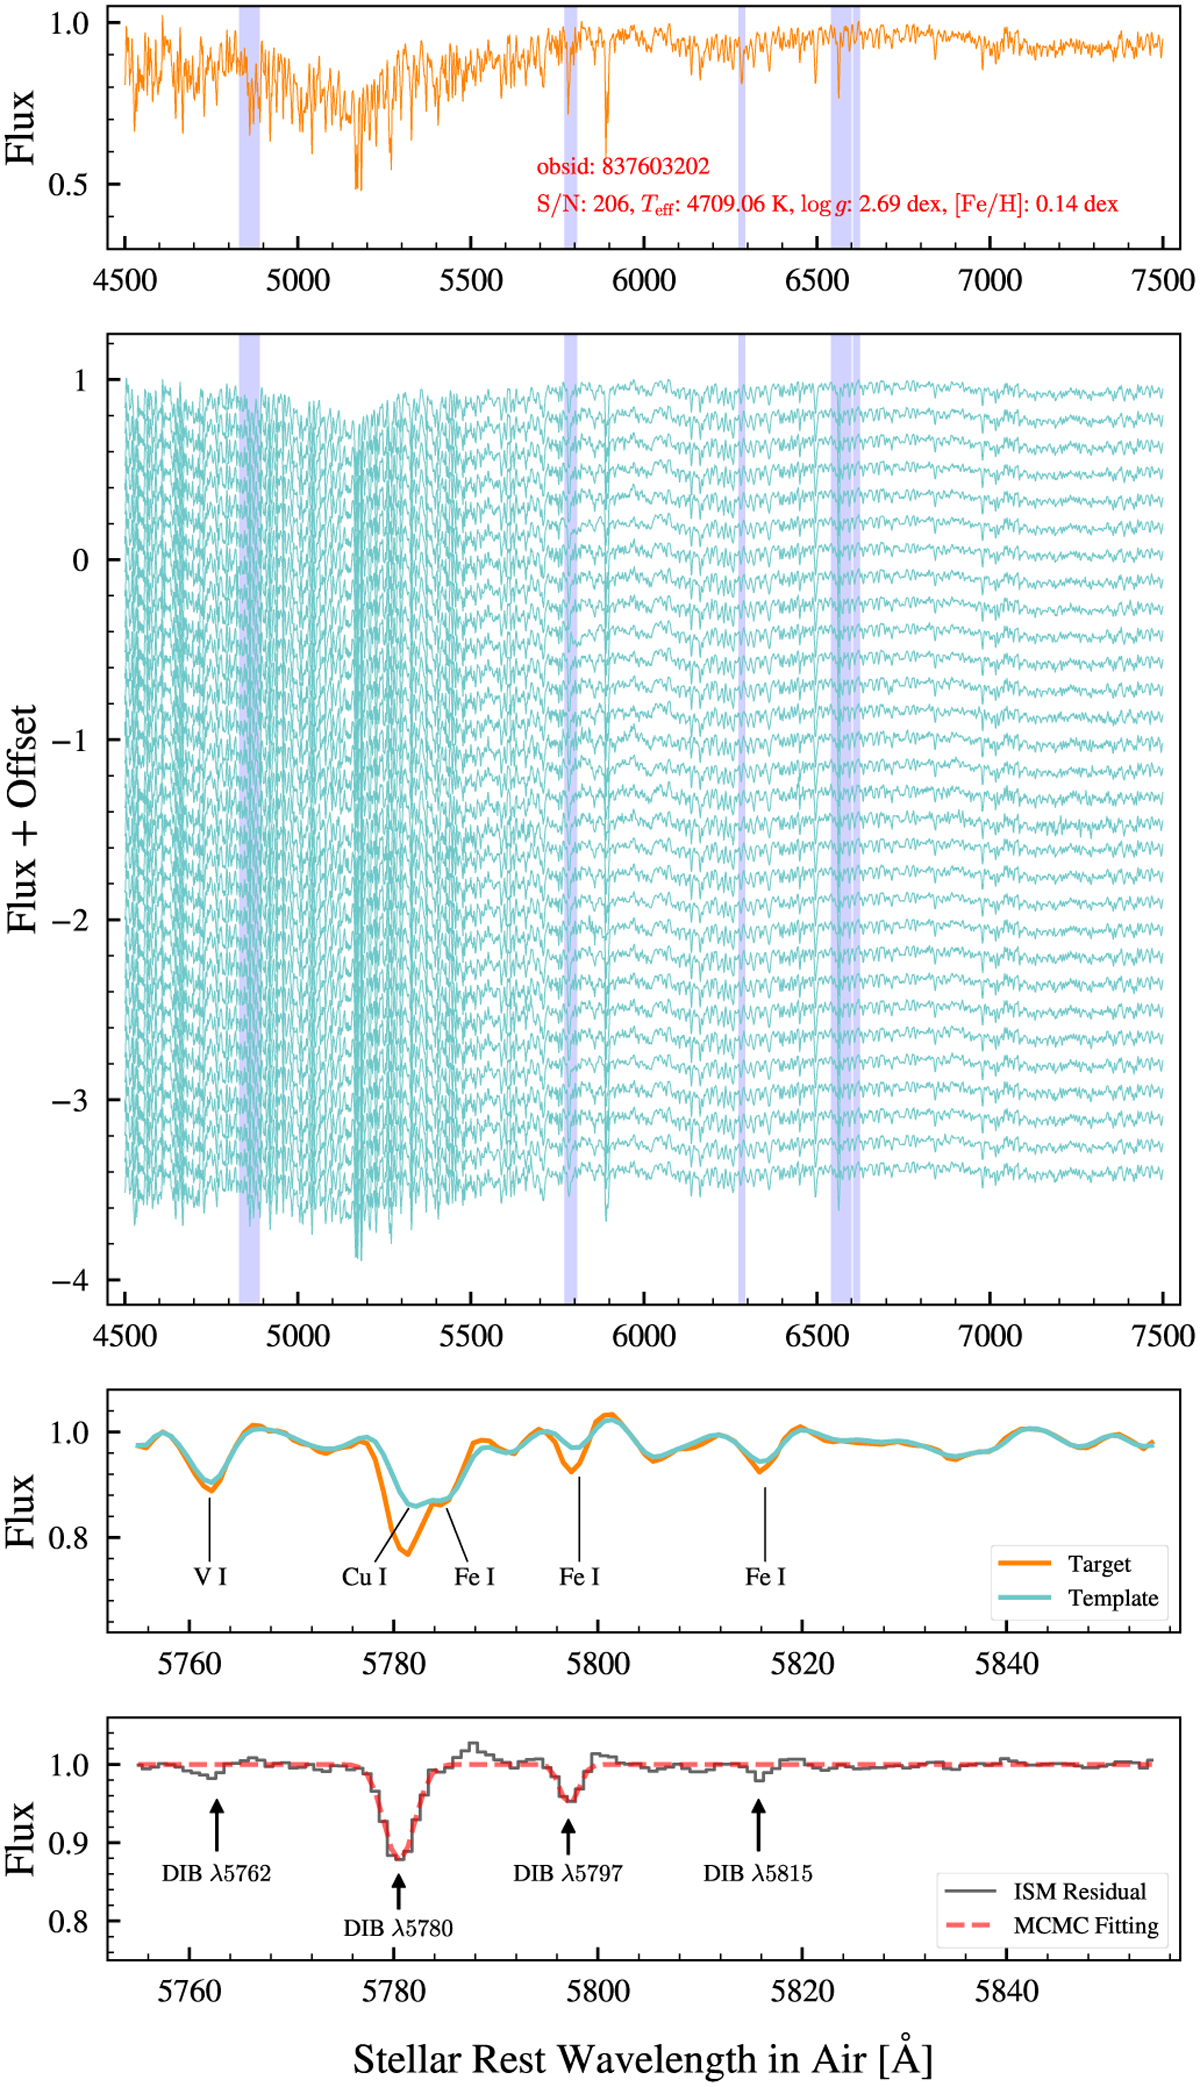
Example measurement of the DIBs λ5780 and λ5797 from a target spectrum. From top to bottom, (i) the first panel shows the target spectrum to be measured, with the red text indicating its obsid (the unique ID of the spectrum in the LAMOST catalog) and atmospheric parameters. (ii) The second panel provides the first 30 best neighboring spectra of the target spectrum, which are used to build the template spectrum displayed in the third panel. The purple-shaded areas in the first and second panels are the masked regions that do not participate in the similarity computation. (iii) The third panel illustrates the target and template spectrum after local normalization. The most prominent stellar absorptions that may affect the DIB extraction are annotated in the panel. (iv) The fourth panel presents the ISM residual spectrum (in black) of the target and the fit (in red) of the DIBs λ5780 and λ5797 by MCMC. The shallow DIBs λ5762 and λ5815 in the ISM residual spectrum are also annotated but not fitted in the panel.
Current usage metrics show cumulative count of Article Views (full-text article views including HTML views, PDF and ePub downloads, according to the available data) and Abstracts Views on Vision4Press platform.
Data correspond to usage on the plateform after 2015. The current usage metrics is available 48-96 hours after online publication and is updated daily on week days.
Initial download of the metrics may take a while.