Fig. 13
Download original image
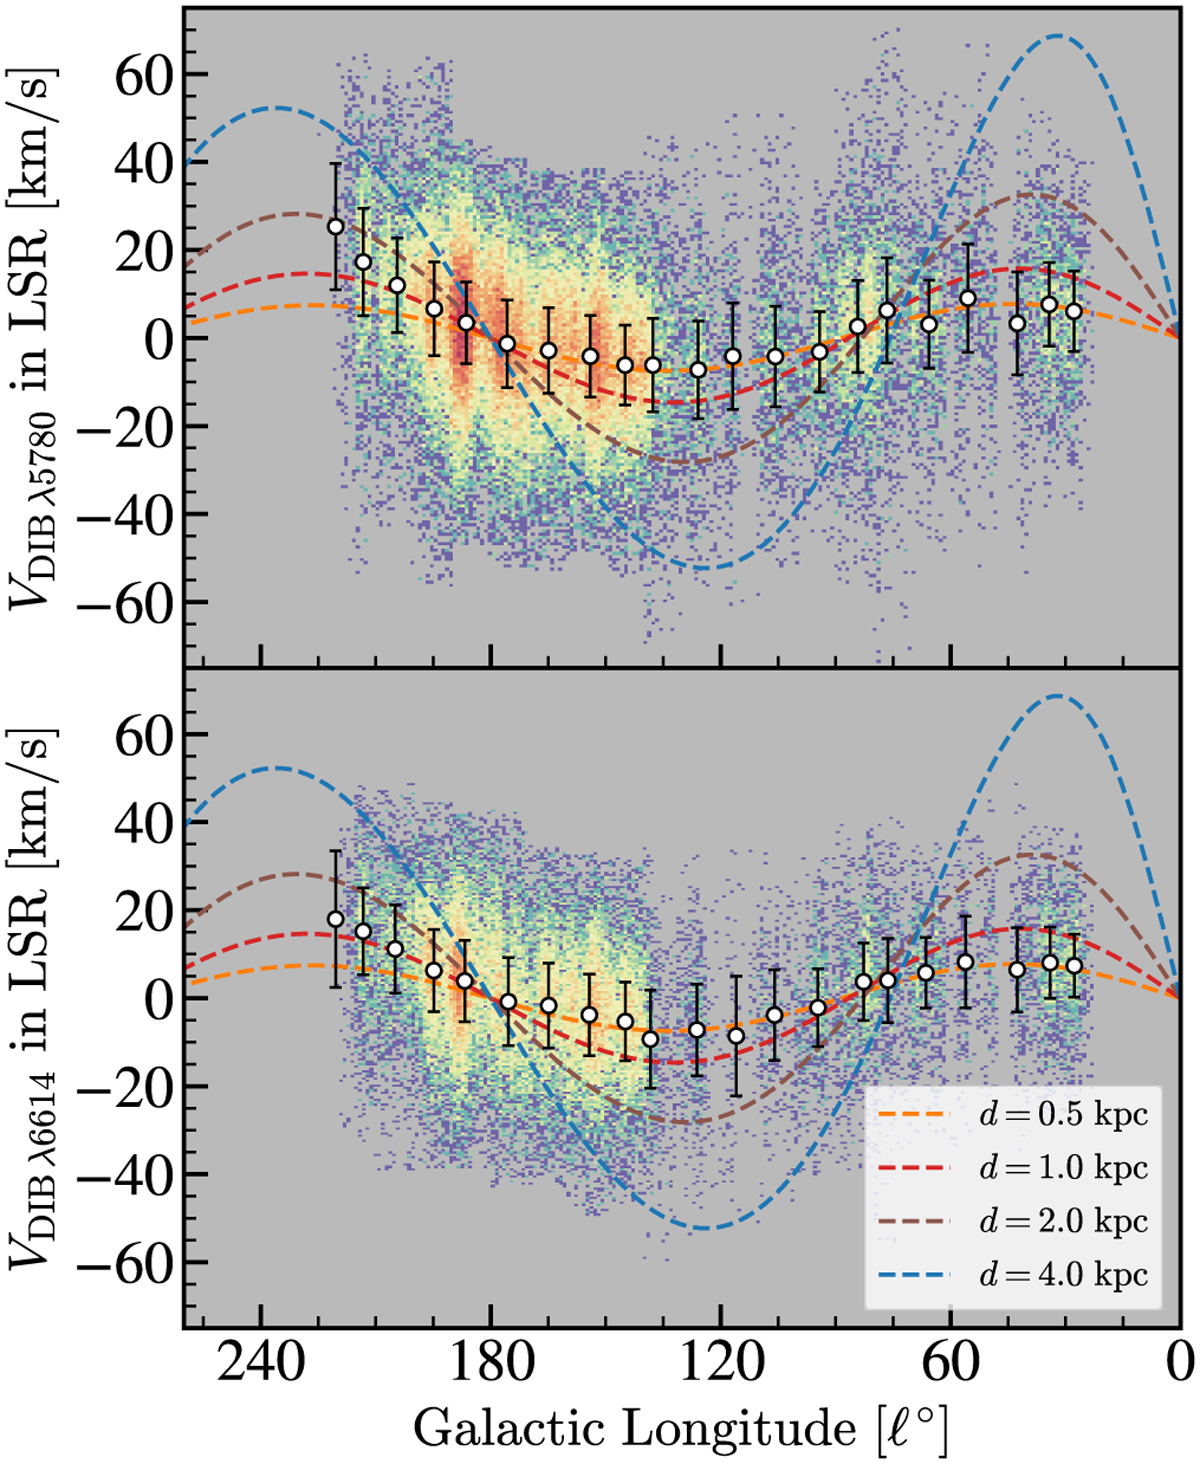
Tow-dimensional histogram of the LSR velocity of the DIBs 45780 (upper panel) and 46614 (lower panel) as a function of the Galactic longitude. The medians and the standard deviations in each ∆ℓ = 10° bin are denoted by the white dots and their black error bars. The Galactic velocity curves with different heliocentric distances d calculated by the Model A5 of Reid et al. (2019) are overlaid in the plots.
Current usage metrics show cumulative count of Article Views (full-text article views including HTML views, PDF and ePub downloads, according to the available data) and Abstracts Views on Vision4Press platform.
Data correspond to usage on the plateform after 2015. The current usage metrics is available 48-96 hours after online publication and is updated daily on week days.
Initial download of the metrics may take a while.