Fig. 12

Download original image
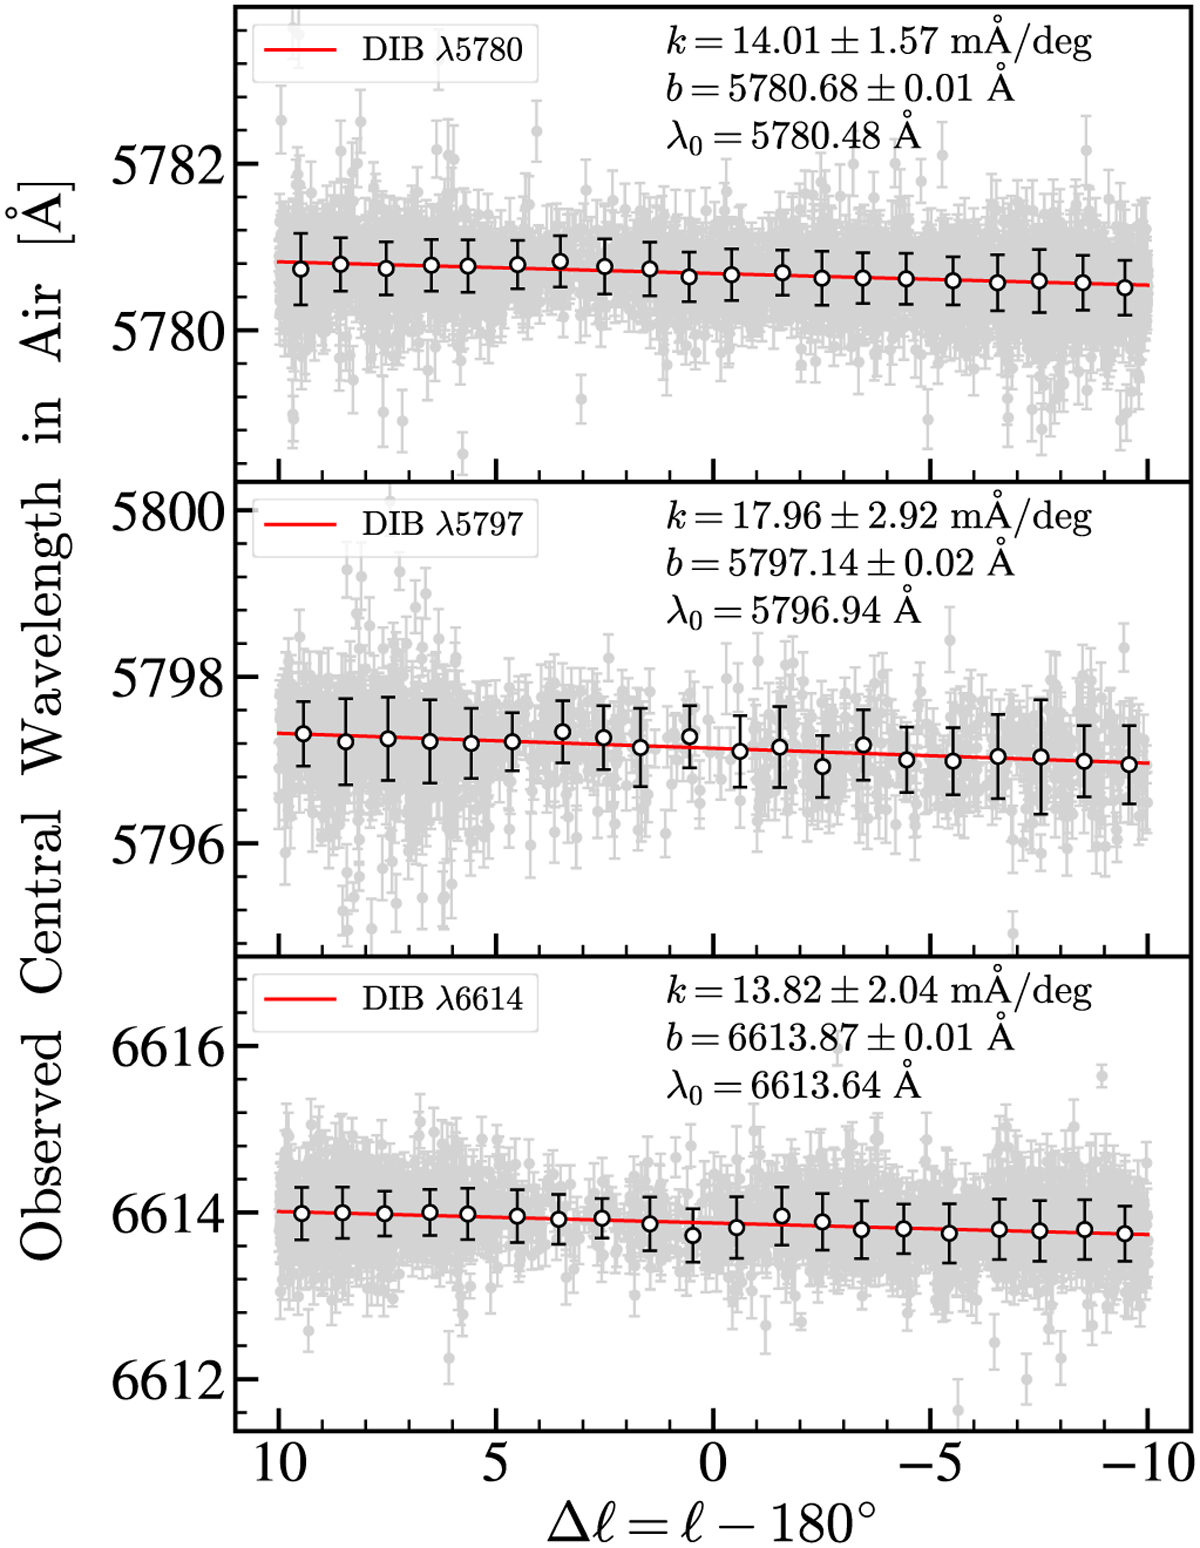
Observed central wavelength (λobs) of the DIBs λ5780, λ5797, and λ6614 as a function of the angular distance (∆ℓ) from the GAC, from top to bottom. The gray dots and their error bars represent the measurements of the central wavelength of DIB and the corresponding uncertainties. The white dots and their black error bars denote the medians and the standard deviations in each ∆ℓ = 1° bin. The red lines are the linear fits to the medians of each bin using the least squares method. The fitting results, that is, the slopes k, the intercepts b, and the final central wavelengths λ0 considering the solar motion, are annotated in each panel.
Current usage metrics show cumulative count of Article Views (full-text article views including HTML views, PDF and ePub downloads, according to the available data) and Abstracts Views on Vision4Press platform.
Data correspond to usage on the plateform after 2015. The current usage metrics is available 48-96 hours after online publication and is updated daily on week days.
Initial download of the metrics may take a while.


