Fig. 10
Download original image
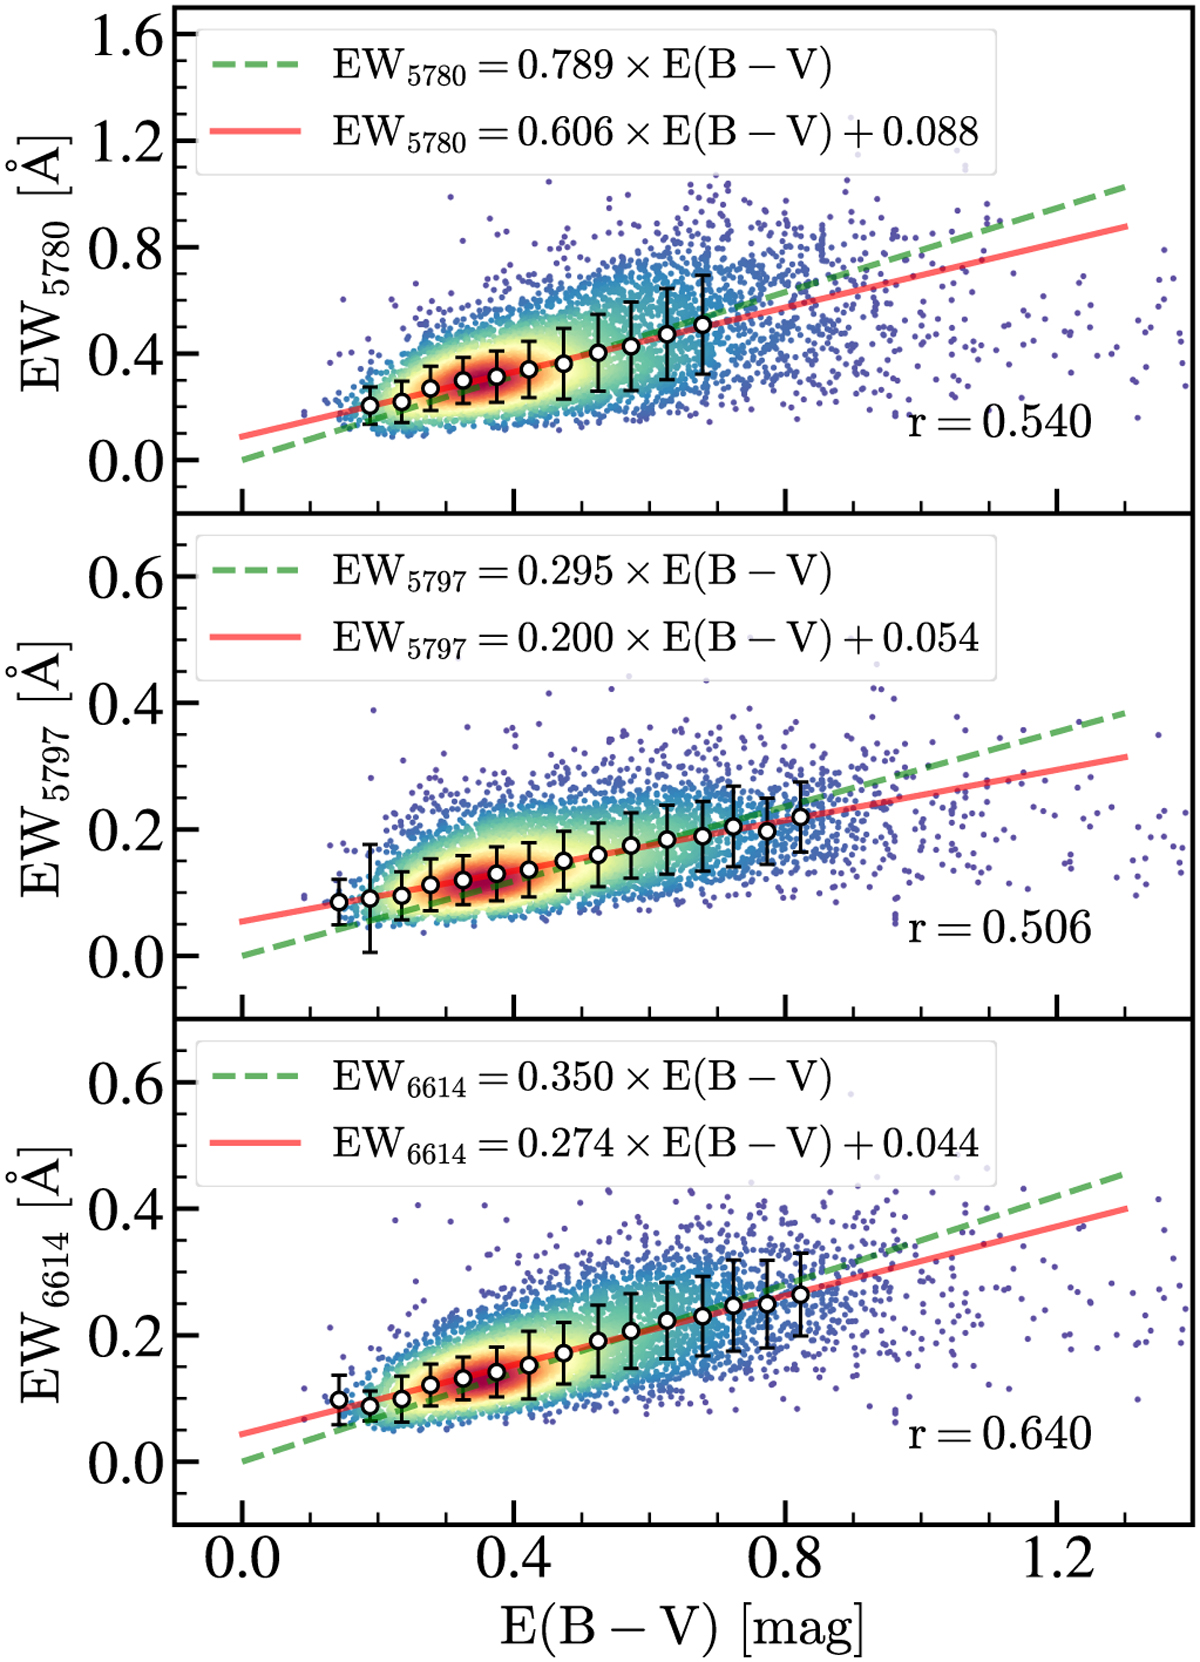
Gaussian KDE number density plot of the EWs of the DIBs λ5780, λ5797, and λ6614 (from top to bottom) as a function of the extinction E(B − V) derived from Green et al. (2019). For each panel, the red solid line represents a linear fit to the median EW (which is marked with a white dot, and its standard deviation marked is with a black error bar) in each ΔE(B − V) = 0.05 mag bin. The green dashed line is the same as the red solid line, but the intercept is forced to be zero. The coefficients of the linear fit and the Pearson correlation coefficient between the EW and E(B − V) are also annotated in each panel.
Current usage metrics show cumulative count of Article Views (full-text article views including HTML views, PDF and ePub downloads, according to the available data) and Abstracts Views on Vision4Press platform.
Data correspond to usage on the plateform after 2015. The current usage metrics is available 48-96 hours after online publication and is updated daily on week days.
Initial download of the metrics may take a while.