Open Access
Fig. 1
Download original image
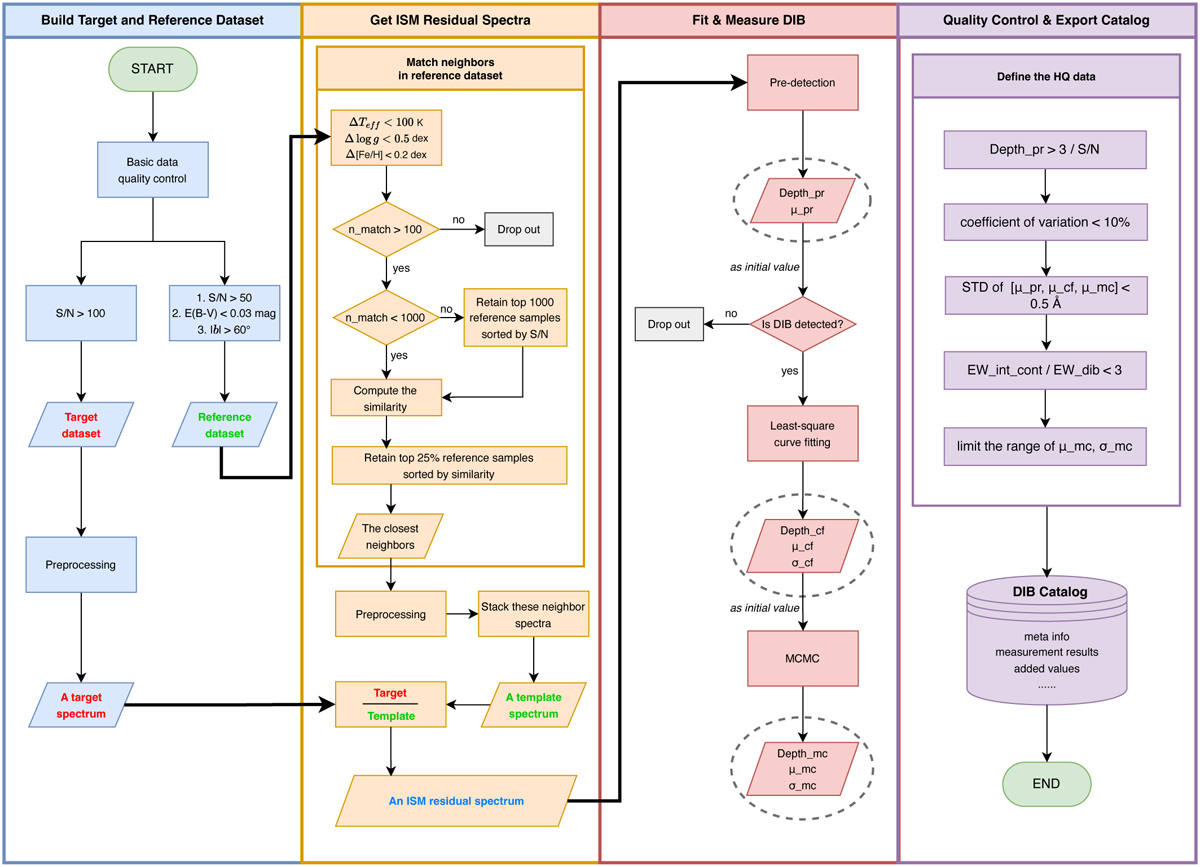
Schematic flowchart of the pipeline for measuring the DIBs λ5780, λ5797, and λ6614 of cool stars in the LAMOST LRS DR10. Four colors encode the four parts of the pipeline, and the output of each modular function is used for the input of the subsequent one.
Current usage metrics show cumulative count of Article Views (full-text article views including HTML views, PDF and ePub downloads, according to the available data) and Abstracts Views on Vision4Press platform.
Data correspond to usage on the plateform after 2015. The current usage metrics is available 48-96 hours after online publication and is updated daily on week days.
Initial download of the metrics may take a while.