Fig. 6
Download original image
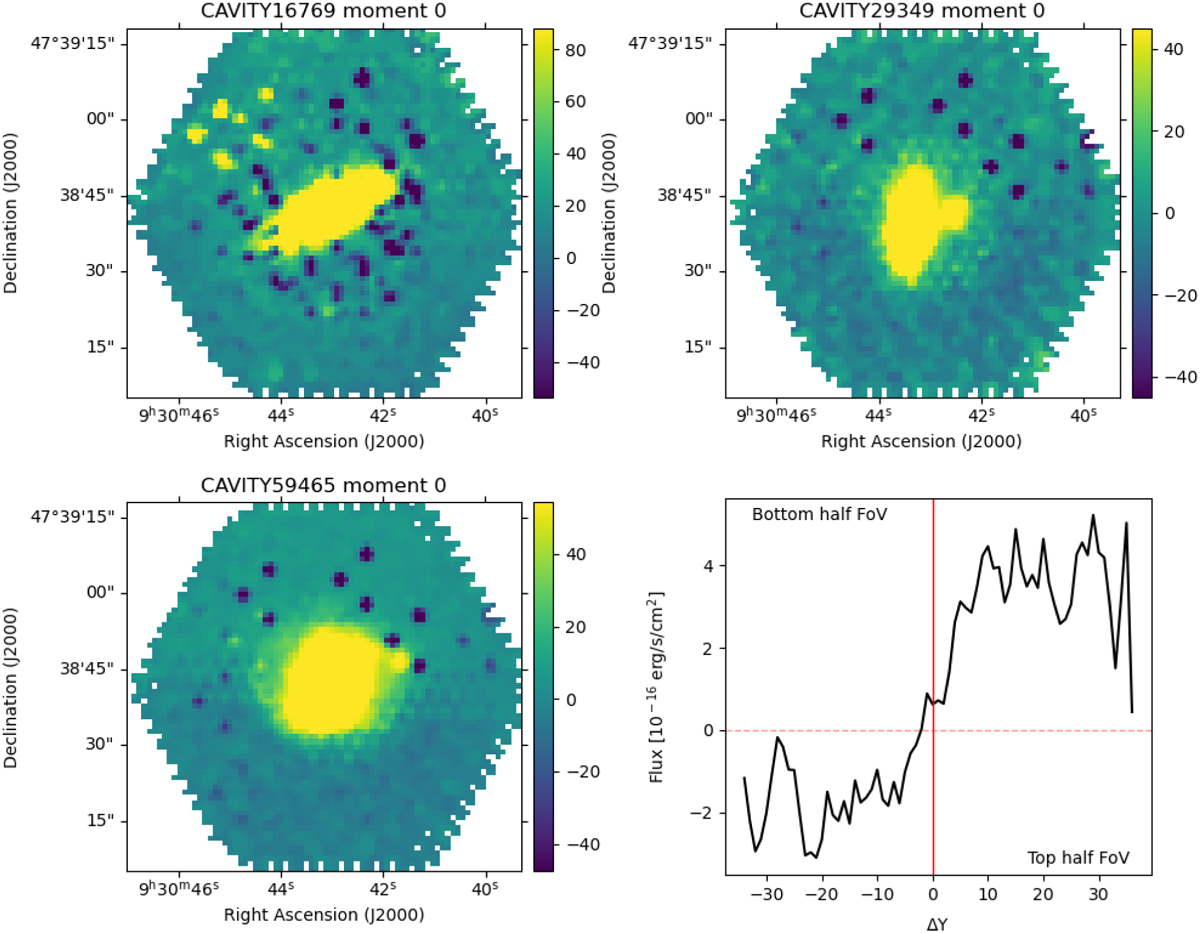
Examples of CAVITY DR1 data cubes affected by cosmetic issues. Top-left: CAVITY 16769 displays clear examples of bright and faint patches due to variable fiber transmission. Top-right: CAVITY 29349 shows a patchy, hexagonal pattern in the central regions consequence of the dithering scheme. Bottom panels exemplify the gradient in the faintest regions for CAVITY 59465. In the left we show the moment 0 image while the right-hand panel displays bottom-to-top profile of the background flux. All moment 0 images (from 4500 to 7000 Å) are in units of 10−16 erg cm−2 s−1.
Current usage metrics show cumulative count of Article Views (full-text article views including HTML views, PDF and ePub downloads, according to the available data) and Abstracts Views on Vision4Press platform.
Data correspond to usage on the plateform after 2015. The current usage metrics is available 48-96 hours after online publication and is updated daily on week days.
Initial download of the metrics may take a while.