Fig. 4
Download original image
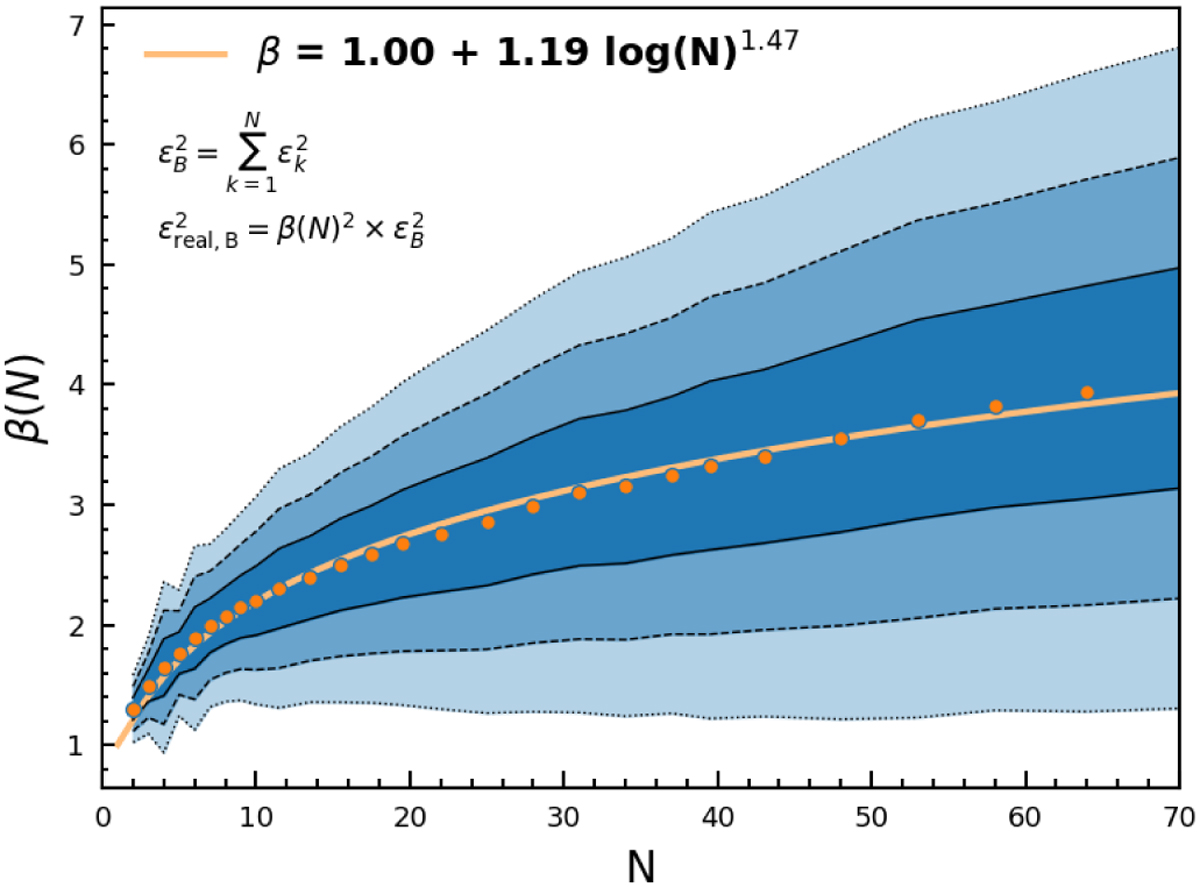
Correction factor to the noise introduced by the spatial covariance, β(N) (ratio of the real estimated error to the analytically propagated error), as a function of the number of co-added adjacent spaxels for all the DR1 V500 data. Shaded regions indicate the 1σ, 2σ, and 3σ width areas around the average value, represented by solid circles. The solid line shows the best-fitted model, following logarithmic parameter-isation, as shown in the legend.
Current usage metrics show cumulative count of Article Views (full-text article views including HTML views, PDF and ePub downloads, according to the available data) and Abstracts Views on Vision4Press platform.
Data correspond to usage on the plateform after 2015. The current usage metrics is available 48-96 hours after online publication and is updated daily on week days.
Initial download of the metrics may take a while.