Fig. 2
Download original image
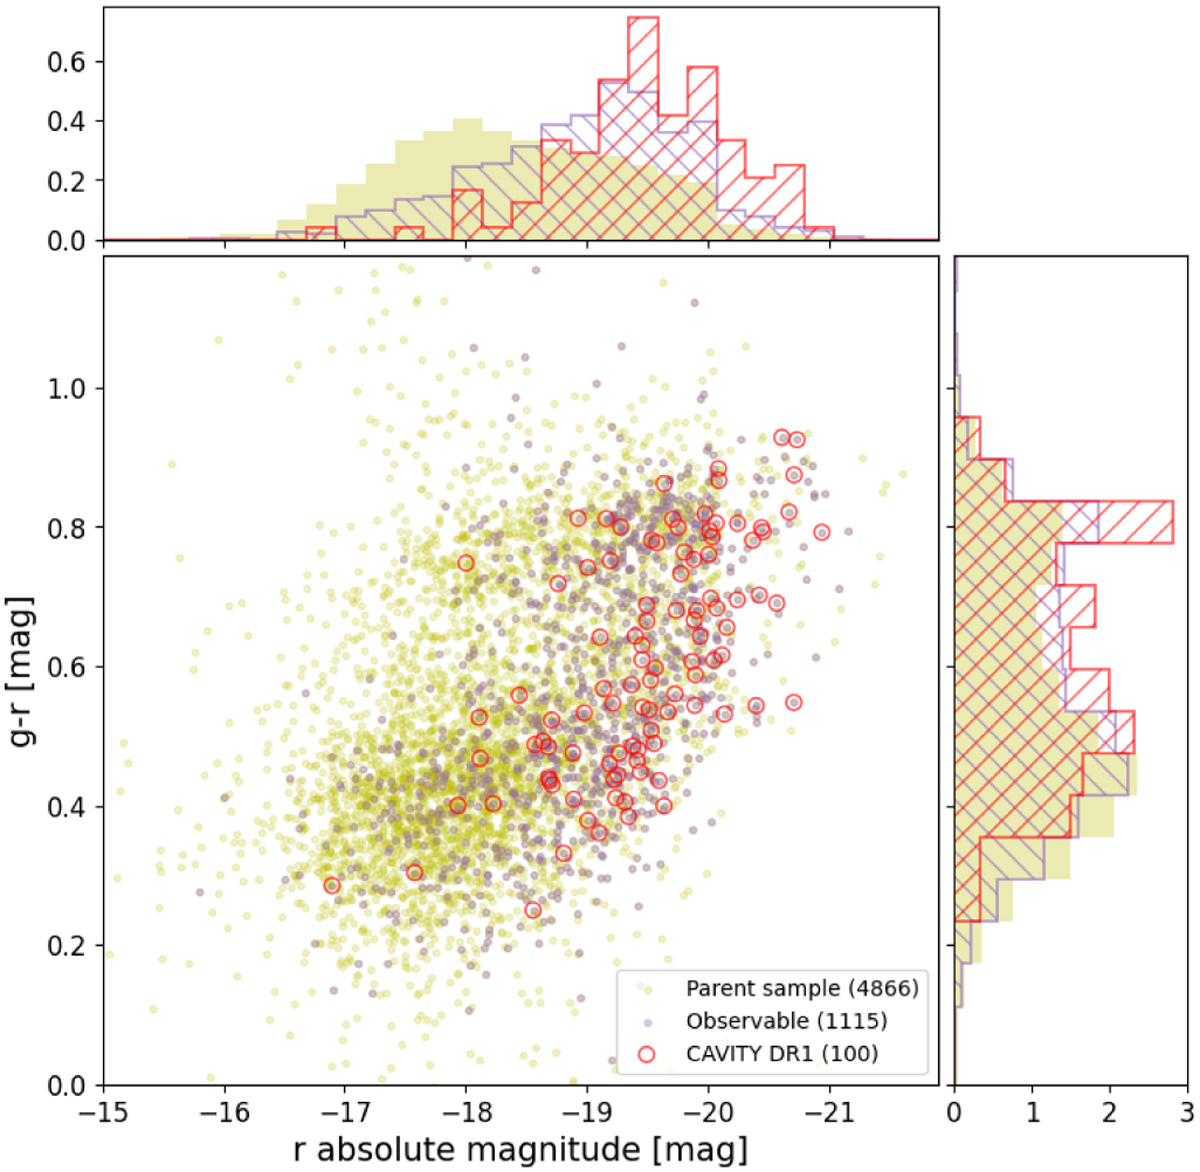
Distribution of CAVITY galaxies in the SDSS 𝑔–r vs. Mr colormagnitude diagram. Yellow dots (histograms) denote galaxies in the CAVITY parent sample (4886 galaxies), while violet and red are used for the observable subsample (1115) and the final CAVITY DR1 sample (100). Color and absolute magnitude distributions are displayed in the top and side panels.
Current usage metrics show cumulative count of Article Views (full-text article views including HTML views, PDF and ePub downloads, according to the available data) and Abstracts Views on Vision4Press platform.
Data correspond to usage on the plateform after 2015. The current usage metrics is available 48-96 hours after online publication and is updated daily on week days.
Initial download of the metrics may take a while.