Fig. 1
Download original image
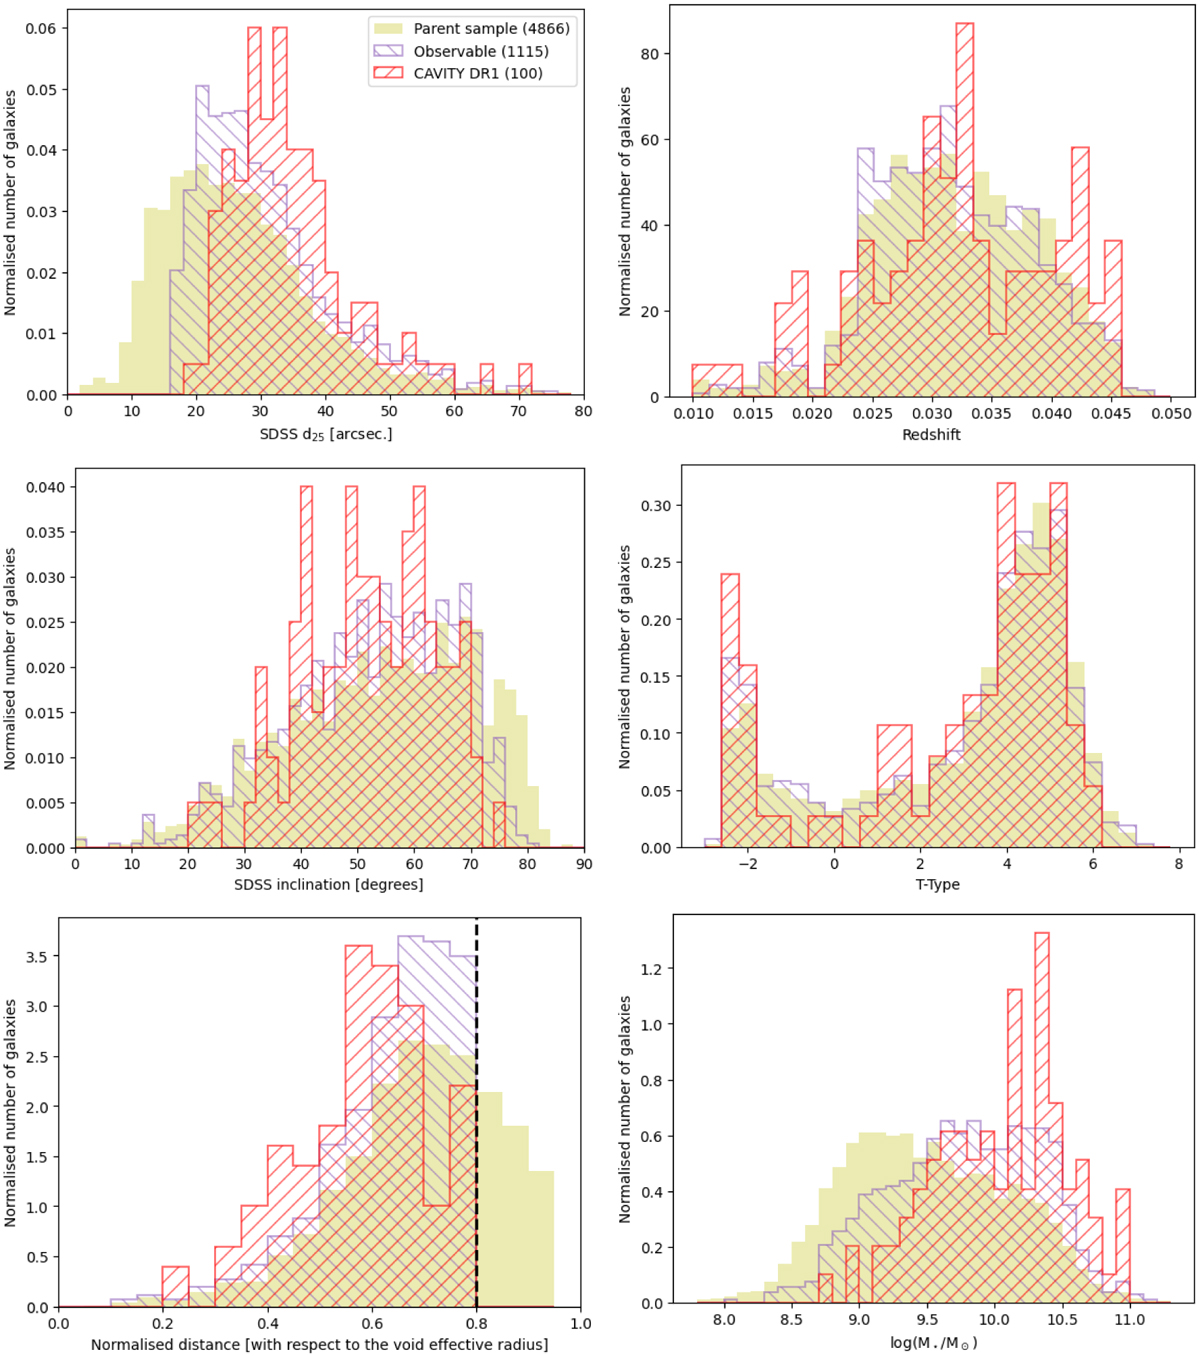
Characterisation of the DR1 CAVITY sample in comparison with the CAVITY parent sample and observable sample that observed galaxies are drawn from (see text for details). From top to bottom and left to right, we show the distribution of d25 (see text for definition), the stellar mass, the inclination from SDSS, the morphological T-Type, the normalised distance to the center of the voids, and the redshift. In light-green are the histograms corresponding to the CAVITY parent sample, in violet the observable sample, and in red the final CAVITY DR1 sample. The right part with respect to the black vertical dashed line in the normalised distance to the centre of the void panel histogram (bottom-left) represents the most external parts of the void (area between 0.8 and 1.0 times the void effective radius). This region is avoided as it can be considered as a transition zone from the void to the filamentary-like environment.
Current usage metrics show cumulative count of Article Views (full-text article views including HTML views, PDF and ePub downloads, according to the available data) and Abstracts Views on Vision4Press platform.
Data correspond to usage on the plateform after 2015. The current usage metrics is available 48-96 hours after online publication and is updated daily on week days.
Initial download of the metrics may take a while.