Open Access
Fig. A.1
Download original image
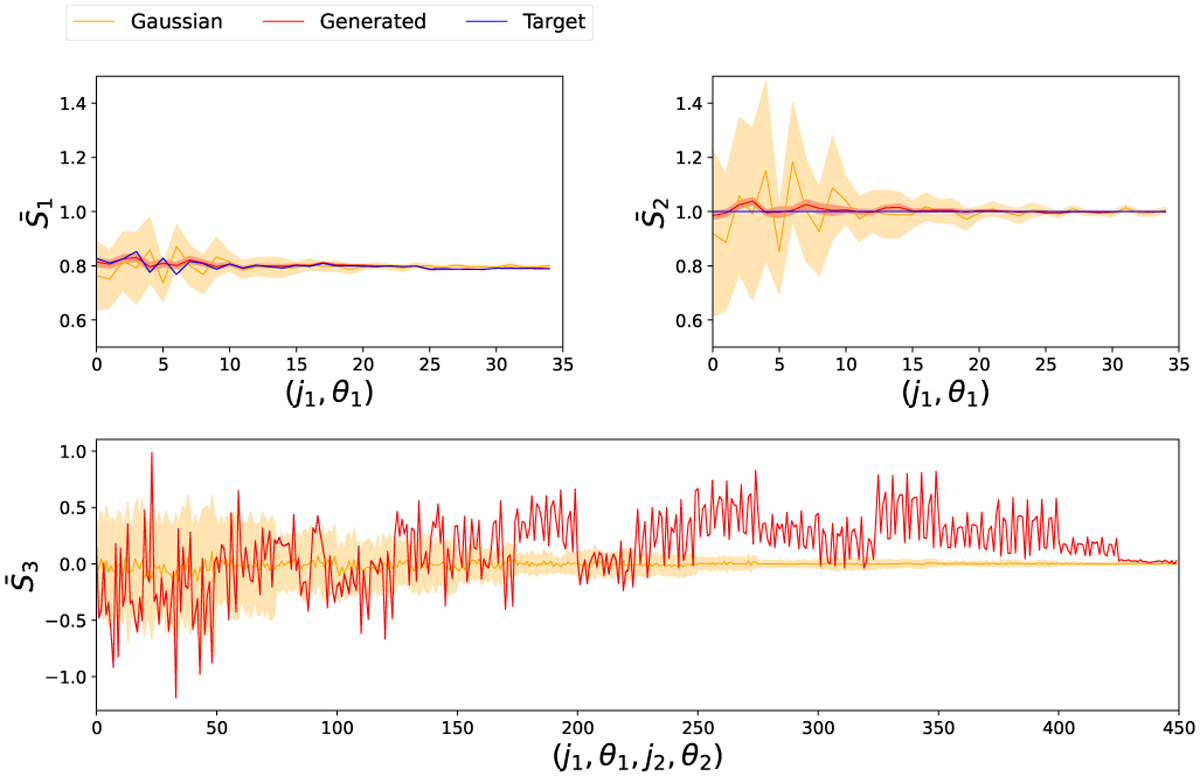
Normalised SC coefficients. We plot ![]() for the logarithm of the LSS field. We show the coefficients from the target field (blue), the generated fields (red), and the equivalent Gaussian realisations (yellow). The mean and the standard deviation over 50 realisations are shown as a solid line with a shadow envelope.
for the logarithm of the LSS field. We show the coefficients from the target field (blue), the generated fields (red), and the equivalent Gaussian realisations (yellow). The mean and the standard deviation over 50 realisations are shown as a solid line with a shadow envelope.
Current usage metrics show cumulative count of Article Views (full-text article views including HTML views, PDF and ePub downloads, according to the available data) and Abstracts Views on Vision4Press platform.
Data correspond to usage on the plateform after 2015. The current usage metrics is available 48-96 hours after online publication and is updated daily on week days.
Initial download of the metrics may take a while.