Fig. 5
Download original image
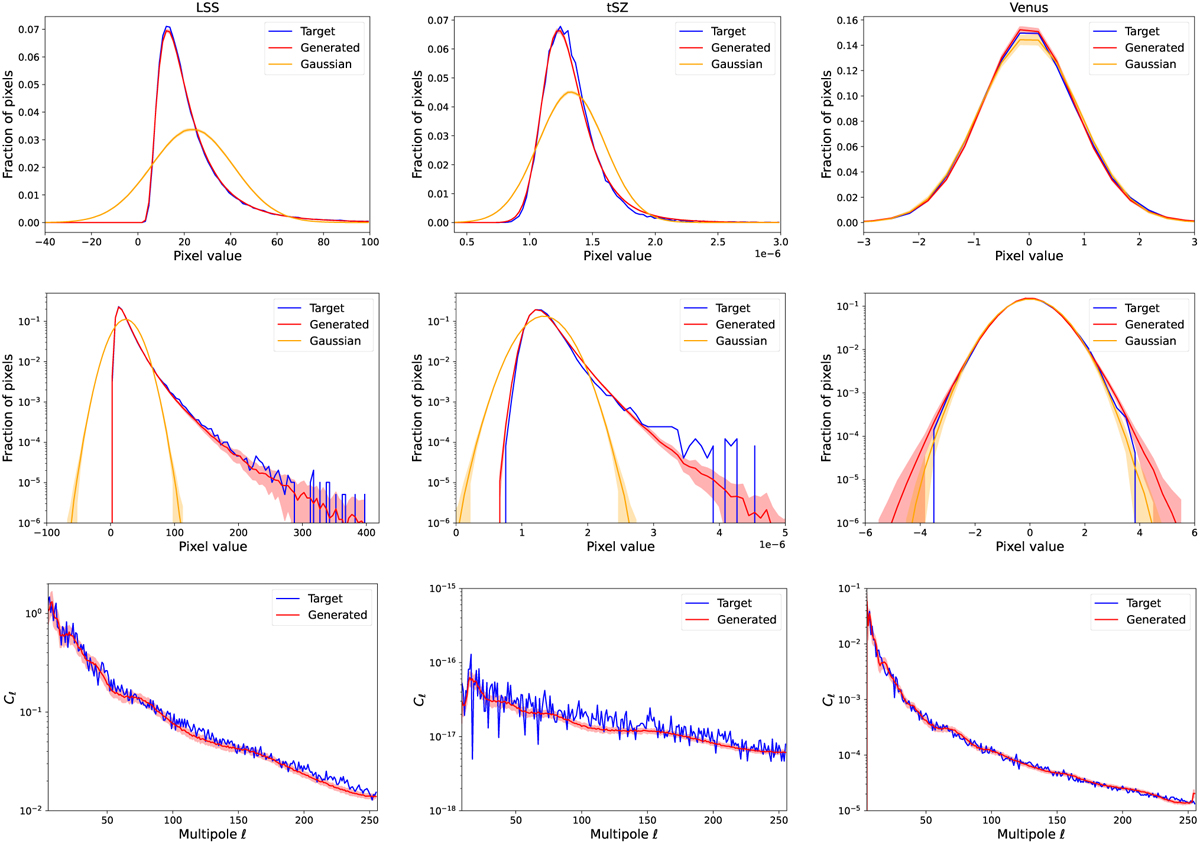
Statistical validation. The PDF and angular power spectra for the LSS, tSZ, and Venus fields (left to right). The first row shows the PDF with a linear y-axis scaling, while the second row shows the same PDF with a logarithmic y-axis. The third row shows the angular power spectra. The target is shown in blue, the generated fields in red, and the Gaussian realisations in yellow. We plotted the mean (solid line) and the standard deviation (shadow envelope) over 50 realisations.
Current usage metrics show cumulative count of Article Views (full-text article views including HTML views, PDF and ePub downloads, according to the available data) and Abstracts Views on Vision4Press platform.
Data correspond to usage on the plateform after 2015. The current usage metrics is available 48-96 hours after online publication and is updated daily on week days.
Initial download of the metrics may take a while.