Fig. 3
Download original image
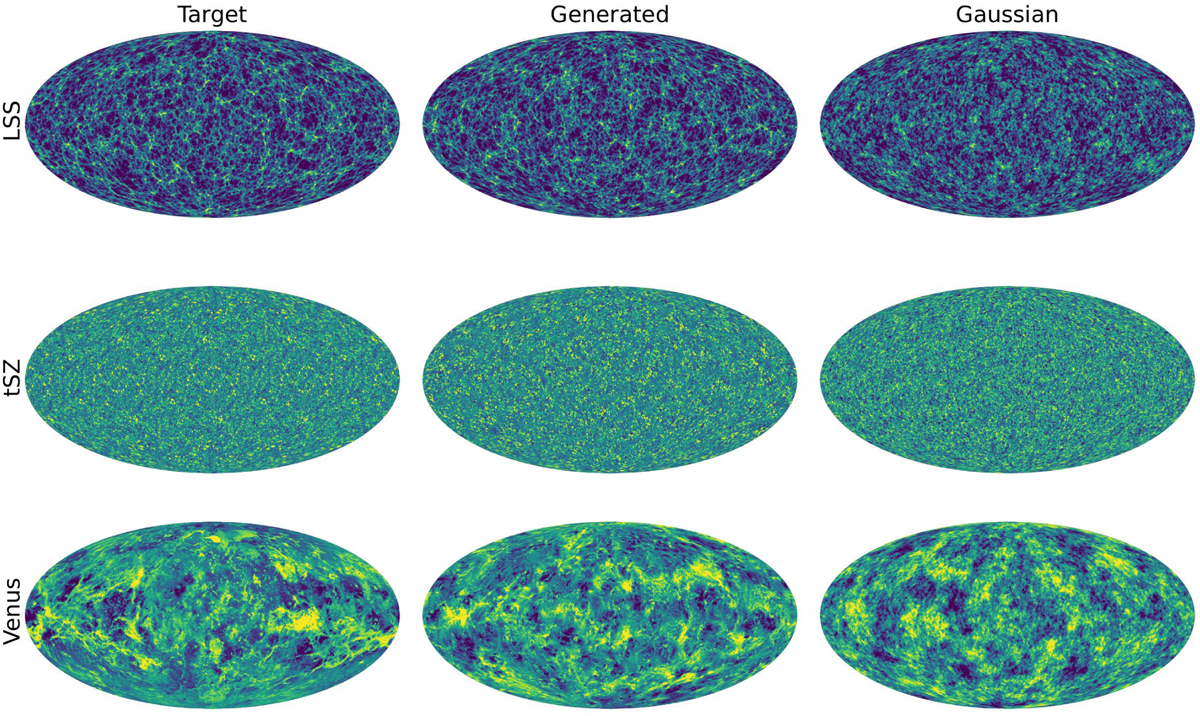
Visual validation of the generative model. From top to bottom, we show the maps for the LSS, tSZ, and Venus fields. The left column is the original target field. The central column shows one sample of the generated maps. The right column shows a Gaussian field with the same power spectrum as the target. For LSS and tSZ, we plotted the logarithm of the fields in order to better see the texture details. The colour bars are identical within each field.
Current usage metrics show cumulative count of Article Views (full-text article views including HTML views, PDF and ePub downloads, according to the available data) and Abstracts Views on Vision4Press platform.
Data correspond to usage on the plateform after 2015. The current usage metrics is available 48-96 hours after online publication and is updated daily on week days.
Initial download of the metrics may take a while.