Fig. 9.
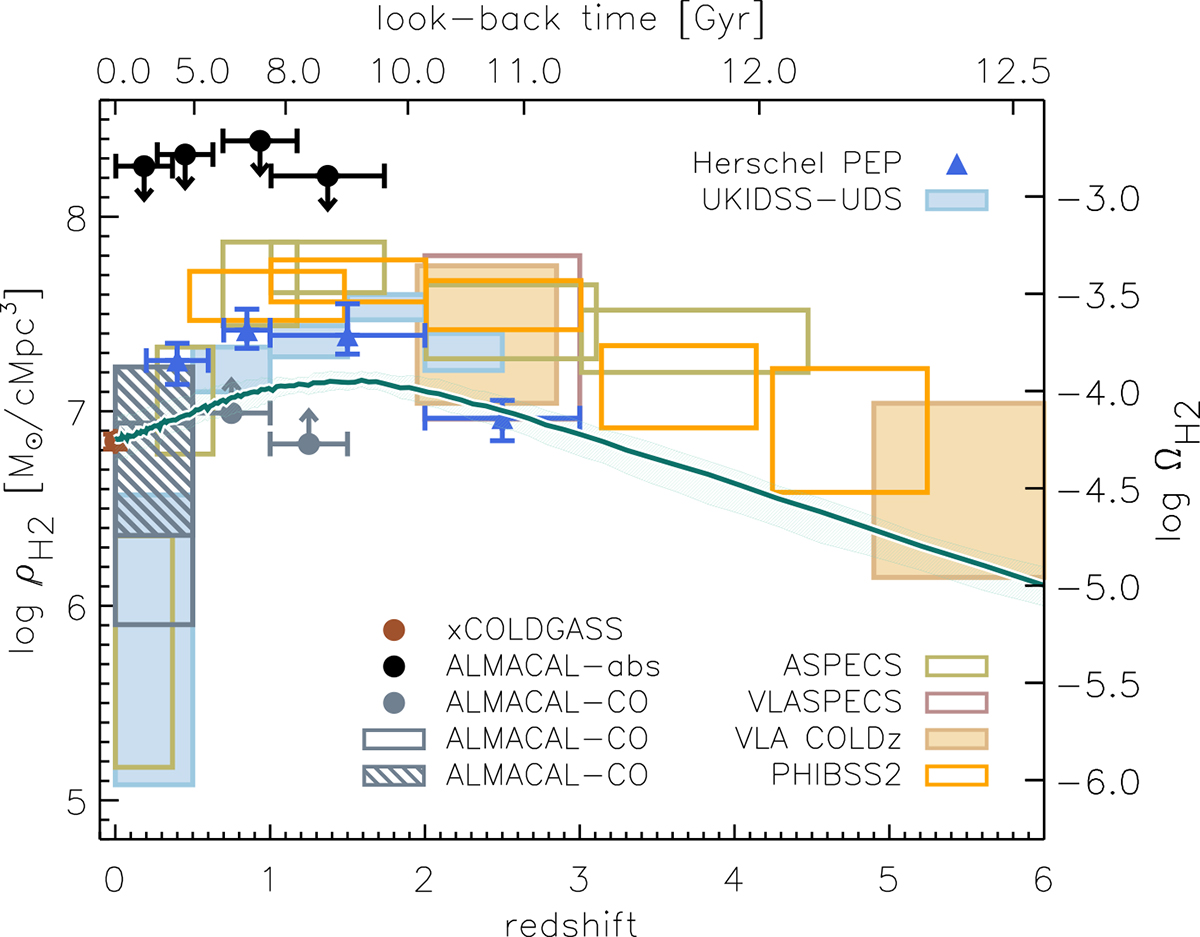
Download original image
Mean cosmic evolution of the molecular hydrogen density considering the five simulated boxes. The shaded region encloses the full dispersion of the five curves. The right-hand axis shows ΩH2, the H2 mass density normalised to the present-day critical density. Observational constraints are ASPECS (ALMA Spectroscopic Survey in the Hubble Ultra Deep Field, Decarli et al. 2020); VLASPECS (which uses the NSF’s Karl G. Jansky Very Large Array, VLA, covering part of the ASPECS footprint, Riechers et al. 2020); COLDz (VLA CO Luminosity Density at High Redshift in the COSMOS and GOODS-North fields combined; Riechers et al. 2019); PHIBBS2 (Plateau de Bure High-z Blue Sequence Survey 2, which uses the NOrthern Extended Millimeter Array – NOEMA – to observe field sources, Lenkić et al. 2020); xCOLD GASS (eXtended CO Legacy Database for the Galaxy All Sky Survey, Fletcher et al. 2021); ALMACAL-abs (blind search of CO absorbers against the ALMA Calibrator archive sources, Klitsch et al. 2019); ALMACAL-CO (CO emission-line survey Hamanowicz et al. 2023); Herschel PEP (PACS Evolutionary Probes Herschel survey in the GOODS-N -S fields, Berta et al. 2013); and UKIDS-UDS (UK InfraRed Telescope – UKIRT – Infrared Deep Sky Survey in the Ultra-Deep Survey, Garratt et al. 2021). Data listed in the top right legend do not use direct measurement of CO emission to estimate molecular masses.
Current usage metrics show cumulative count of Article Views (full-text article views including HTML views, PDF and ePub downloads, according to the available data) and Abstracts Views on Vision4Press platform.
Data correspond to usage on the plateform after 2015. The current usage metrics is available 48-96 hours after online publication and is updated daily on week days.
Initial download of the metrics may take a while.