Fig. 8.
Download original image
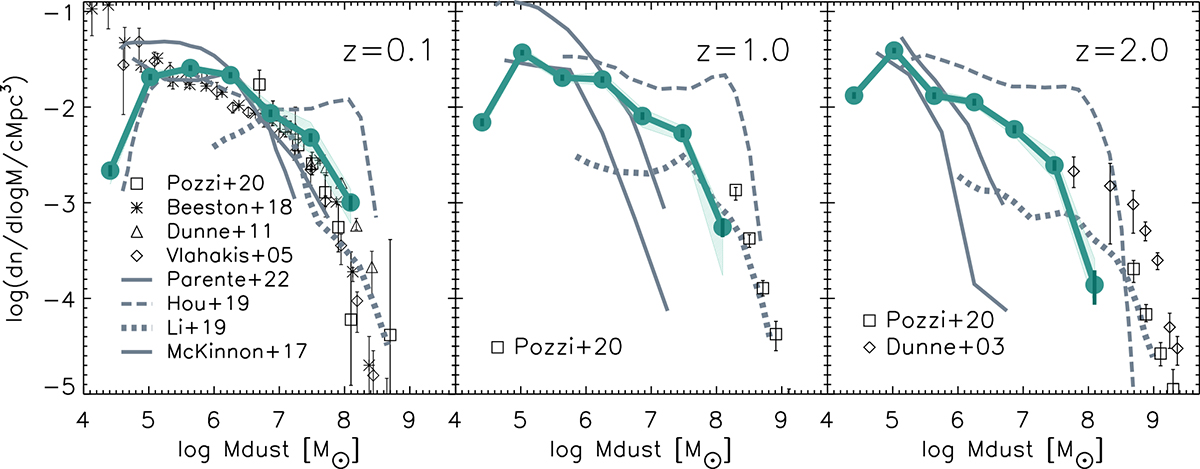
Dust mass function at z = 0.1, z = 1, and z = 2 considering galaxies in the five simulated boxes are represented by green dots connected by solid lines. The error bars represent the Poissonian error for each dust mass bin. The shaded green region encompasses the full dispersion of the individual DMF corresponding to each of the five simulation boxes. The decline of the DMF at low masses is due to the imposed stellar mass resolution limit. We compare our results with observational data, represented by symbols and simulations delineated by lines. Observations at z = 0.1 correspond to Pozzi et al. (2020), Beeston et al. (2018), Dunne et al. (2011), and Vlahakis et al. (2005), at z = 1 (Pozzi et al. 2020) and at z = 2 (Pozzi et al. 2020 and Dunne et al. 2003). Simulations correspond to the works of Parente et al. (2022), Hou et al. (2019), Li et al. (2019), and McKinnon et al. (2017).
Current usage metrics show cumulative count of Article Views (full-text article views including HTML views, PDF and ePub downloads, according to the available data) and Abstracts Views on Vision4Press platform.
Data correspond to usage on the plateform after 2015. The current usage metrics is available 48-96 hours after online publication and is updated daily on week days.
Initial download of the metrics may take a while.