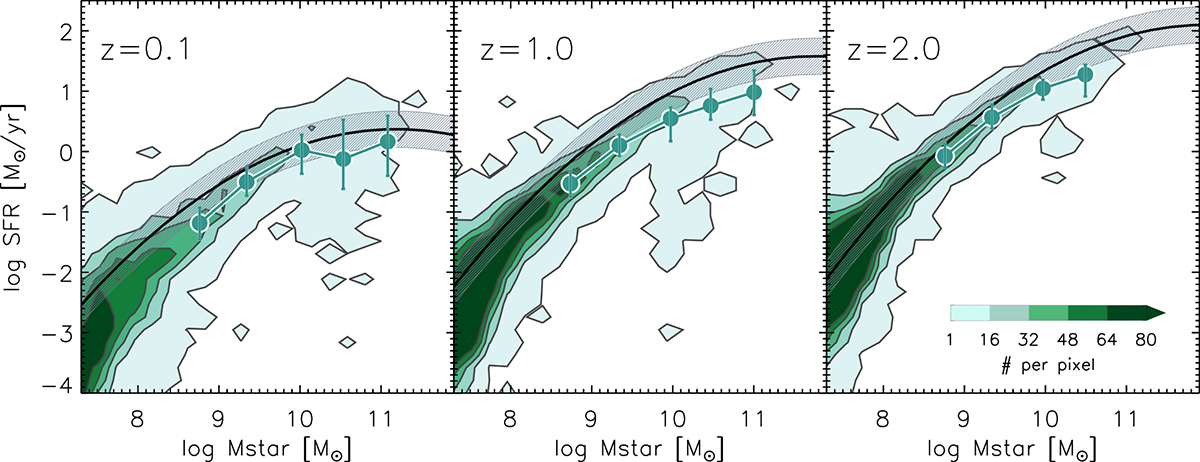
Fig. 6.
Download original image
Distribution of our simulated galaxies in the stellar mass-SFR plane is shown by the contours. Solid black lines are the MS determinations for observed galaxies presented in Popesso et al. (2023), resulting from an extensive homogenized compilation of studies published since 2014 (their Eq. (10)). The shaded grey band visualize the typical dispersion of determinations used to get their fit. The green curves connecting the points represent the median SFR per mass bin for a sub-sample of simulated galaxies selected using the same criteria as in Popesso et al. (2023), namely 8.5 < log(Mstar/M⊙) < 11.5 and 0.01 < SFR/( M⊙ yr−1) < 500. Bars delineate the 25–75% percentiles.
Current usage metrics show cumulative count of Article Views (full-text article views including HTML views, PDF and ePub downloads, according to the available data) and Abstracts Views on Vision4Press platform.
Data correspond to usage on the plateform after 2015. The current usage metrics is available 48-96 hours after online publication and is updated daily on week days.
Initial download of the metrics may take a while.