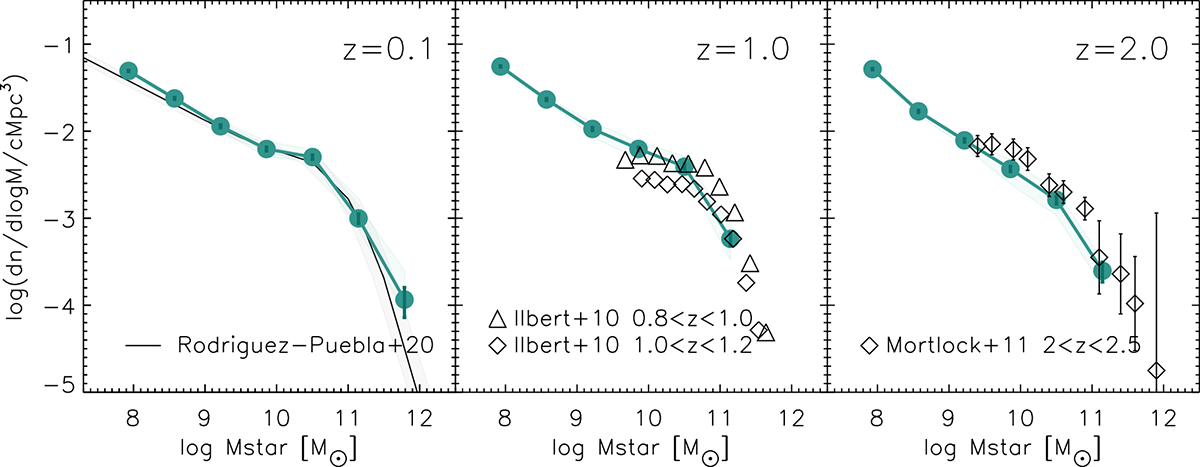
Fig. 5.
Download original image
Stellar mass function is shown by the green curves at z = 0.1, z = 1, and z = 2, based on the five simulated boxes in our fiducial model. The error bars represent Poissonian errors for each stellar mass bin, typically smaller than the size of the point. The shaded green region encompasses the full dispersion of the individual SMFs corresponding to each of the five simulation boxes. We compare our model at z = 0.1 with the best-fit model of Rodríguez-Puebla et al. (2020); the grey area is an estimate of systematic errors which captures variations due to differences in the mass-to-light ratios and mass definitions (photometry) of the observational samples in that work. Simulations at z = 1 are confronted with the data from Ilbert et al. (2010) at two redshift ranges and at z = 2 with the data in Mortlock et al. (2011).
Current usage metrics show cumulative count of Article Views (full-text article views including HTML views, PDF and ePub downloads, according to the available data) and Abstracts Views on Vision4Press platform.
Data correspond to usage on the plateform after 2015. The current usage metrics is available 48-96 hours after online publication and is updated daily on week days.
Initial download of the metrics may take a while.