Fig. 2.
Download original image
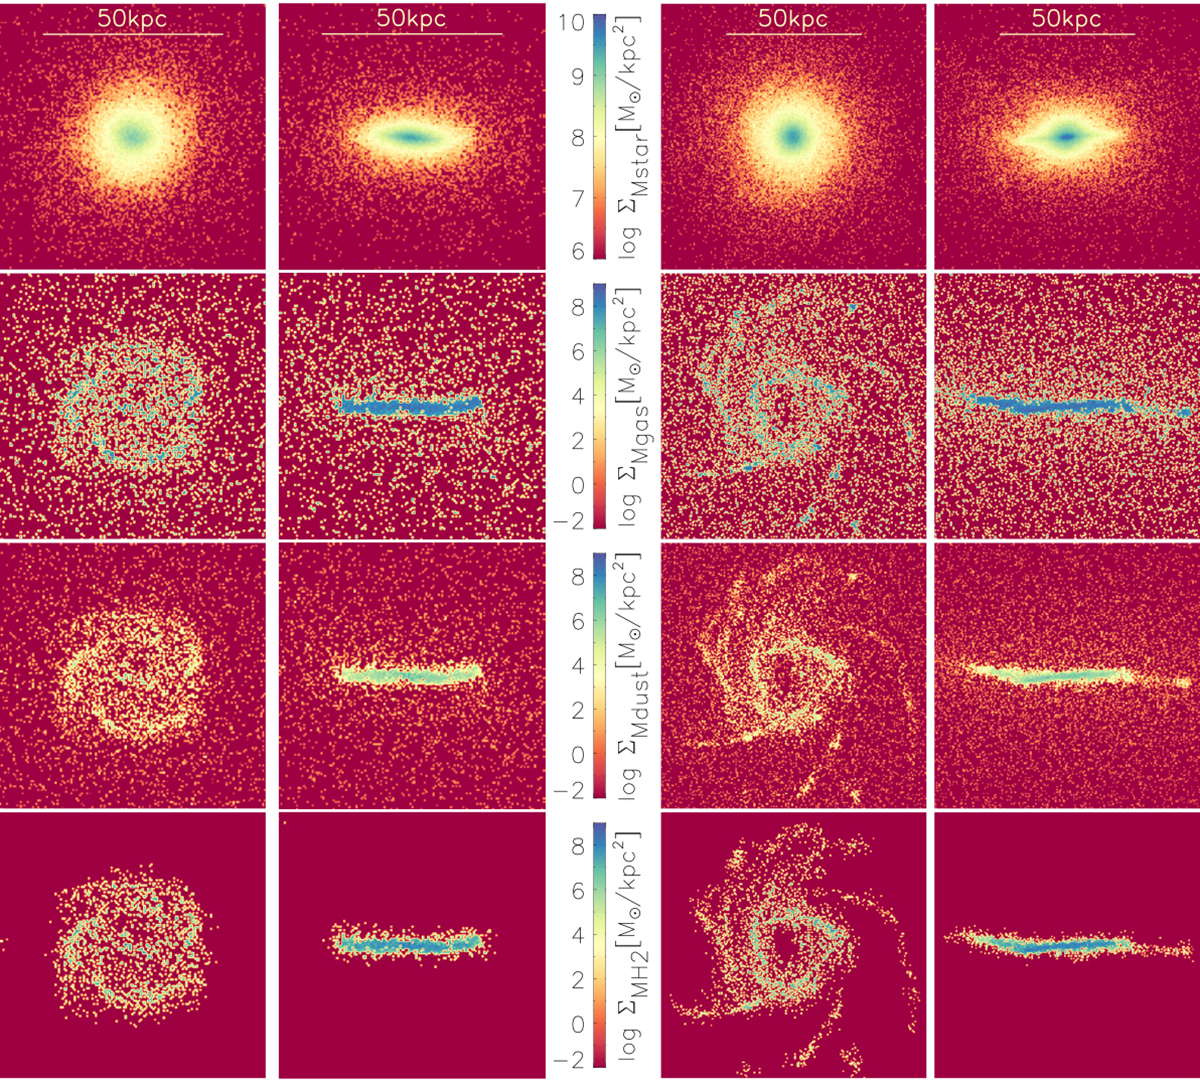
Two examples of disc galaxies from our simulations at z = 0. The four rows depict the mass surface densities of stars, gas, dust, and H2 on pixels of ∼0.5 kpc per side. Columns 1 and 2 illustrate face-on and edge-on views of a galaxy with M200 = 1.5 × 10¹² M⊙, Mstar = 5.3 × 10¹⁰ M⊙, Mgas = 5.0 × 10⁹ M⊙, Mdust = 7.0 × 10⁷ M⊙, and MH2 = 2.2 × 10⁹ M⊙. Columns 3 and 4 show the corresponding maps for a galaxy with M200 = 3.6 × 10¹² M⊙, Mstar = 1.2 × 10¹¹ M⊙, Mgas = 4.6 × 10⁹ M⊙, Mdust = 6.3 × 10⁷ M⊙, and MH2 = 2.0 × 10⁹ M⊙.
Current usage metrics show cumulative count of Article Views (full-text article views including HTML views, PDF and ePub downloads, according to the available data) and Abstracts Views on Vision4Press platform.
Data correspond to usage on the plateform after 2015. The current usage metrics is available 48-96 hours after online publication and is updated daily on week days.
Initial download of the metrics may take a while.