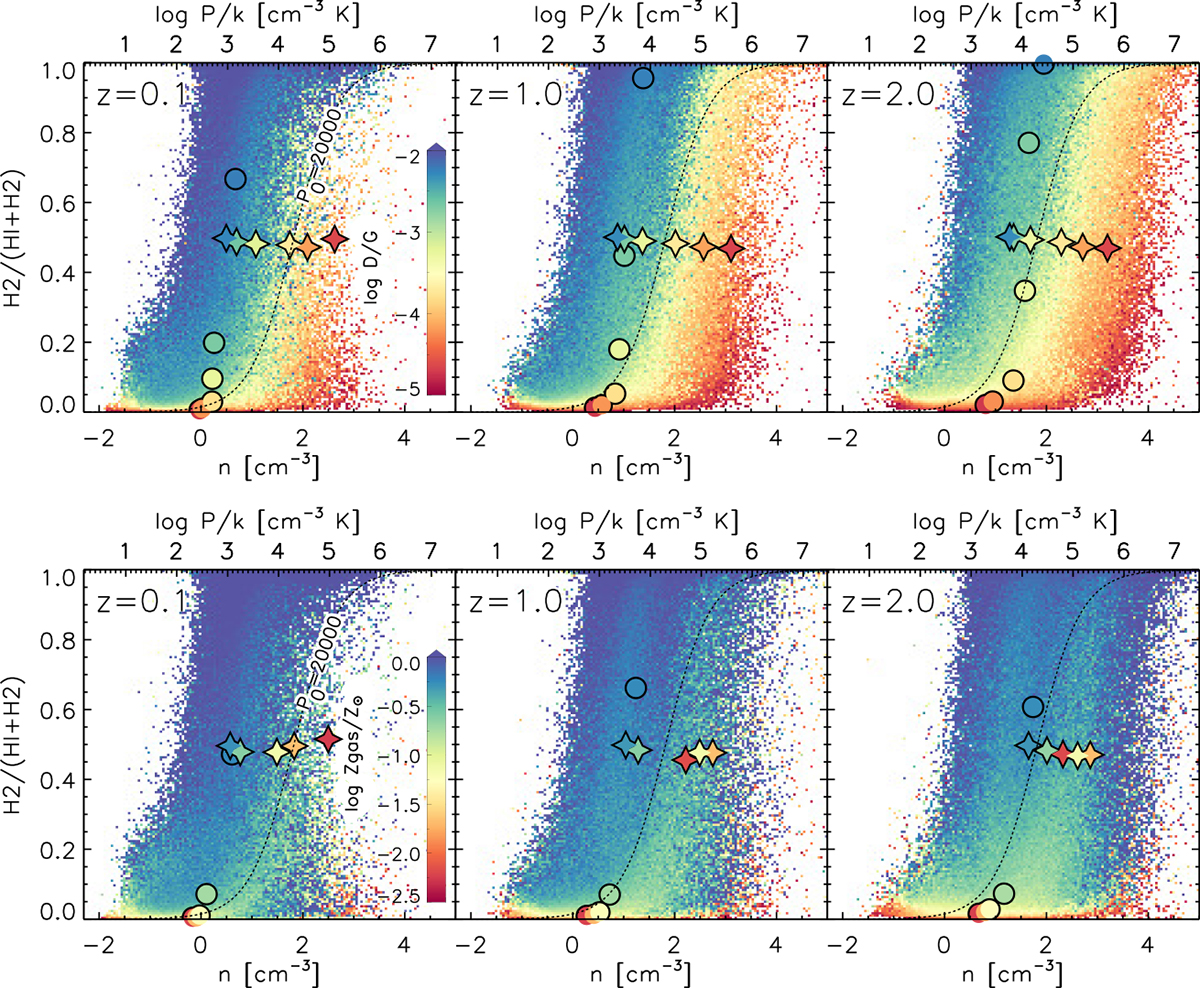
Fig. 16.
Download original image
Transition from atomic to molecular hydrogen in MP particles illustrated for the three analysed redshifts as a function of the sub-grid number density of the cold phase. The latter is assumed to have a temperature 300 K hence the pressure is proportional to the number density and shown in the top axis (k is the Boltzmann constant). The colour code shows the mean D/G mass ratio (top panel) and the gas phase metallicity (metals-to-gas mass ratio, bottom panel) of the gas particles falling within each pixel (150 pixels per axis). colour-coded circles represent the median H2 fraction and number density for particles within 0.5 dex bins of log(D/G) (top panel) and ![]() (bottom panel). Meanwhile, stars indicate the same, but exclusively for particles in the transition region with H2 fraction between 0.4 and 0.6.
(bottom panel). Meanwhile, stars indicate the same, but exclusively for particles in the transition region with H2 fraction between 0.4 and 0.6.
Current usage metrics show cumulative count of Article Views (full-text article views including HTML views, PDF and ePub downloads, according to the available data) and Abstracts Views on Vision4Press platform.
Data correspond to usage on the plateform after 2015. The current usage metrics is available 48-96 hours after online publication and is updated daily on week days.
Initial download of the metrics may take a while.