Fig. 14.
Download original image
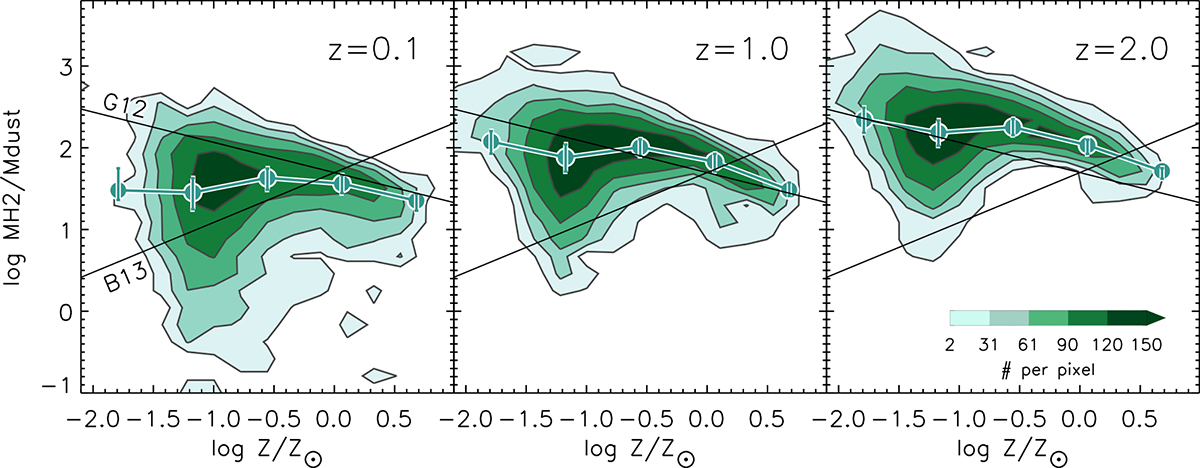
Contours depict the H2-to-dust ratio as a function of gas metallicity for all model galaxies. MS galaxies (![]() ) at the given redshift are represented by the circles, which depict the median H2-to-dust ratio within stellar mass bins, accompanied by the 25%–75% percentiles. The two lines labelled as G12 and B13 correspond to fits obtained in Bertemes et al. (2018) when using the CO-to-H2 conversion factors derived in Genzel et al. (2012) or Bolatto et al. (2013), respectively. The colour contours enclose grids containing a specific number of galaxies as indicated in the colour bar, utilizing 0.2 dex-wide bins along both the x and y axes.
) at the given redshift are represented by the circles, which depict the median H2-to-dust ratio within stellar mass bins, accompanied by the 25%–75% percentiles. The two lines labelled as G12 and B13 correspond to fits obtained in Bertemes et al. (2018) when using the CO-to-H2 conversion factors derived in Genzel et al. (2012) or Bolatto et al. (2013), respectively. The colour contours enclose grids containing a specific number of galaxies as indicated in the colour bar, utilizing 0.2 dex-wide bins along both the x and y axes.
Current usage metrics show cumulative count of Article Views (full-text article views including HTML views, PDF and ePub downloads, according to the available data) and Abstracts Views on Vision4Press platform.
Data correspond to usage on the plateform after 2015. The current usage metrics is available 48-96 hours after online publication and is updated daily on week days.
Initial download of the metrics may take a while.