Fig. 13.
Download original image
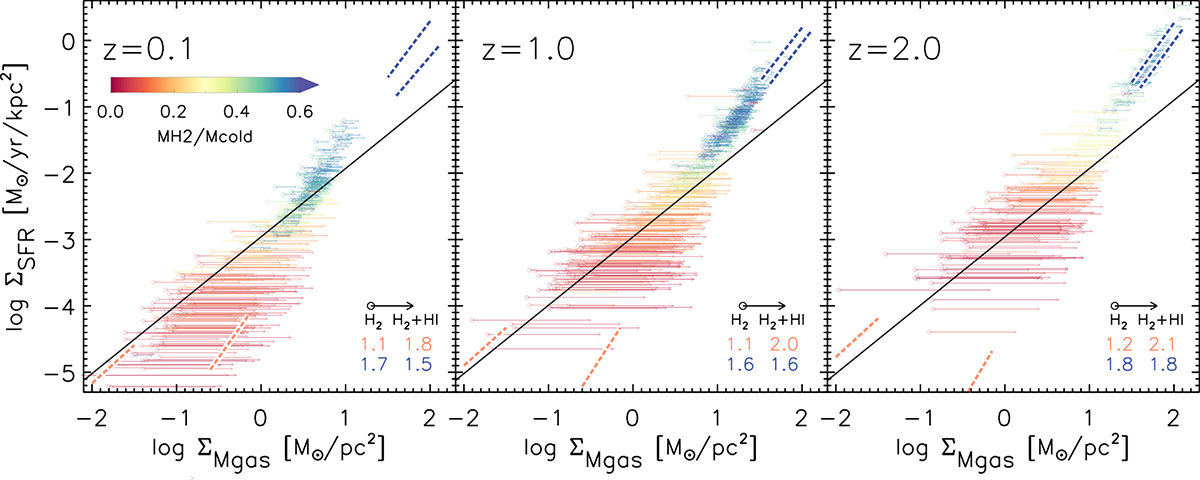
Integrated KS relation. The tail of the arrows represents ΣH2, while the head indicates ΣH2 + HI. We show the results for galaxies with stellar masses Mstar > 108 M⊙ and bulge-to-total ratios B/T < 0.5. The colour bar encodes the H2 fraction of each galaxy. Red/blue dashed line segments are linear fits in the log-log plane for galaxies with H2 fraction lower/greater than 0.5. The corresponding slopes are labelled in each panel for H2 and H2 + HI gas phases. Solid line represents one of the fits (slope n = 1.03) from de los Reyes & Kennicutt (2019) to the ΣH2-ΣSFR relation obtained from a compilation of observational samples of local spirals.
Current usage metrics show cumulative count of Article Views (full-text article views including HTML views, PDF and ePub downloads, according to the available data) and Abstracts Views on Vision4Press platform.
Data correspond to usage on the plateform after 2015. The current usage metrics is available 48-96 hours after online publication and is updated daily on week days.
Initial download of the metrics may take a while.