Fig. 12.
Download original image
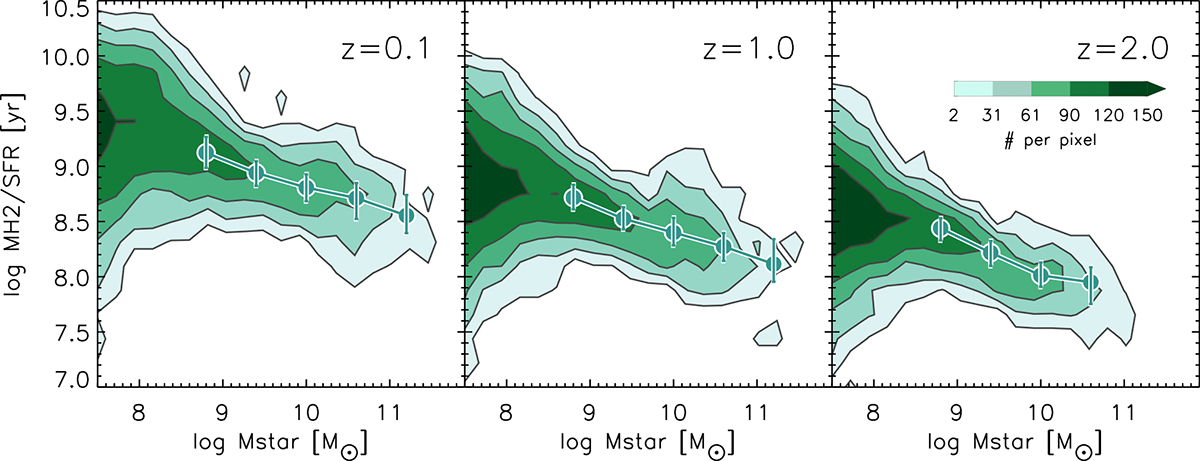
Depletion time as a function of stellar mass for model galaxies. In addition to contours, solid circles display the median depletion time within bins of stellar mass, along with the 25%–75% percentiles for model galaxies with ![]() . The colour contours delineate grids containing a specific number of galaxies as indicated in the colour bar, utilizing 0.2 dex-wide bins along both the x and y axes.
. The colour contours delineate grids containing a specific number of galaxies as indicated in the colour bar, utilizing 0.2 dex-wide bins along both the x and y axes.
Current usage metrics show cumulative count of Article Views (full-text article views including HTML views, PDF and ePub downloads, according to the available data) and Abstracts Views on Vision4Press platform.
Data correspond to usage on the plateform after 2015. The current usage metrics is available 48-96 hours after online publication and is updated daily on week days.
Initial download of the metrics may take a while.