Fig. 10.

Download original image
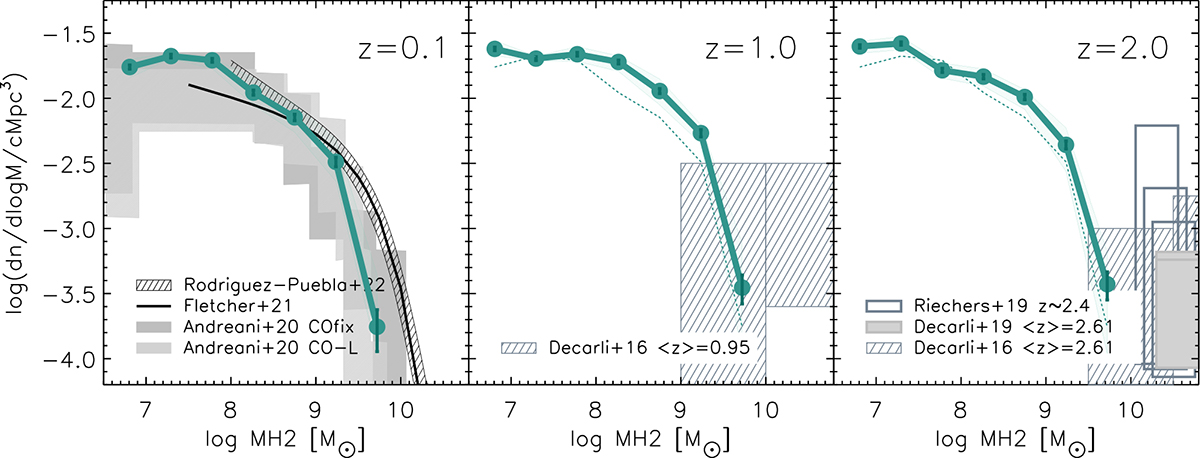
H2 mass function at z = 0.1, 1.0, and z = 2.0. The error bars represent Poissonian errors for each stellar mass bin, typically smaller than the size of the point. The shaded green region encompasses the full dispersion of the individual H2MFs corresponding to each of the five simulation boxes. In the local Universe, we report for comparison the H2 mass function obtained by Andreani et al. (2020), who use a fixed (COfix) or a luminosity dependent (CO-L) CO-to-H2 conversion factor and the best-fit model of Rodríguez-Puebla et al. (2020) and Fletcher et al. (2021). At higher redshifts, the boxes show constraints from Decarli et al. (2016) (ALMA ASPECS-Pilot survey), Decarli et al. (2019) (ALMA ASPECS-LP survey), and Riechers et al. (2019) (COLDz survey). The H2MF at redshift z = 0 is also shown in the middle and right panels using a thin dotted line to facilitate comparison.
Current usage metrics show cumulative count of Article Views (full-text article views including HTML views, PDF and ePub downloads, according to the available data) and Abstracts Views on Vision4Press platform.
Data correspond to usage on the plateform after 2015. The current usage metrics is available 48-96 hours after online publication and is updated daily on week days.
Initial download of the metrics may take a while.


