Fig. 5
Download original image
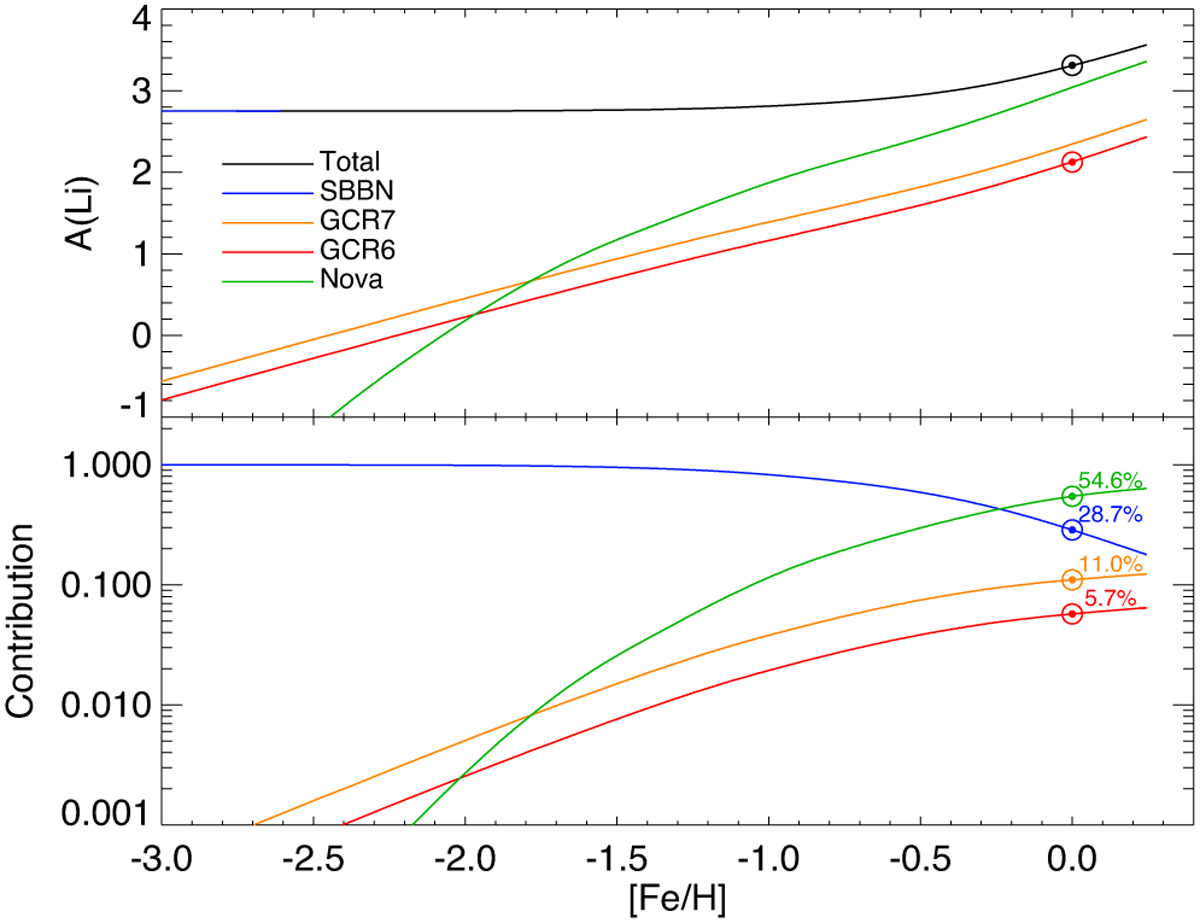
Evolution of Li abundance (top) and relative contributions (by mass) of different Li sources (bottom) as a function of [Fe/H]. In the top panel, the evolution of total abundance is shown in black, and the solar symbols indicate the solar meteoritic values for 6Li and 7Li. The other curves (in both panels) show the components from the BBN, novae, and GCR (two curves for GCR show components both for 6Li and 7Li). In the bottom panel, the solar symbols indicate the contributions at solar metallicity.
Current usage metrics show cumulative count of Article Views (full-text article views including HTML views, PDF and ePub downloads, according to the available data) and Abstracts Views on Vision4Press platform.
Data correspond to usage on the plateform after 2015. The current usage metrics is available 48-96 hours after online publication and is updated daily on week days.
Initial download of the metrics may take a while.