Fig. 4

Download original image
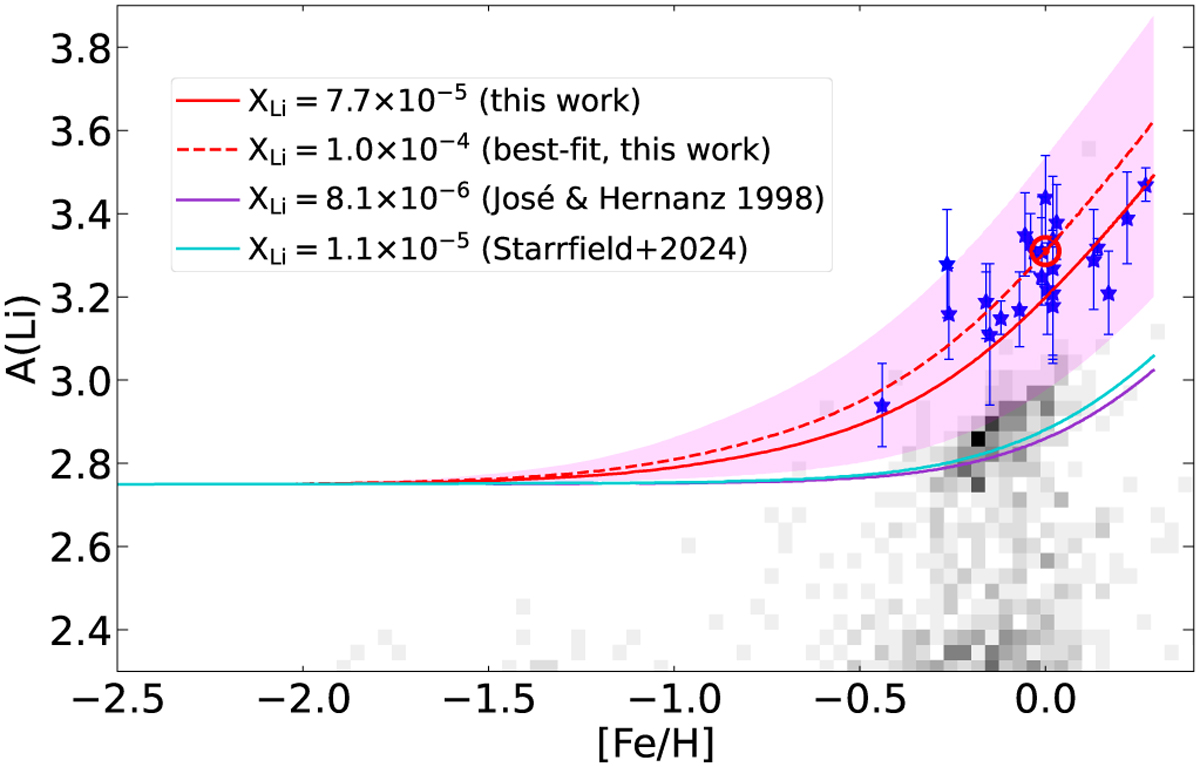
Li abundance as a function of [Fe/H] with nova as a sole stellar source and with different mass fractions of Li in the nova ejecta. Our ‘best-fit’ value (red dashed line) is slightly higher than the mean value of the observational analysis of Molaro et al. (2022) (red solid line), and the pinkish shaded area corresponds to the dispersion of XLi around that mean value. The theoretical nova Li yields of José & Hernanz (1998) and Starrfield et al. (2024) are also used (purple and cyan curves, respectively). The five-pointed stars show the abundance of the open clusters, while the underlying number density plot represents the GALAH sample. The solar symbol indicates the meteoritic value.
Current usage metrics show cumulative count of Article Views (full-text article views including HTML views, PDF and ePub downloads, according to the available data) and Abstracts Views on Vision4Press platform.
Data correspond to usage on the plateform after 2015. The current usage metrics is available 48-96 hours after online publication and is updated daily on week days.
Initial download of the metrics may take a while.


