Fig. 2
Download original image
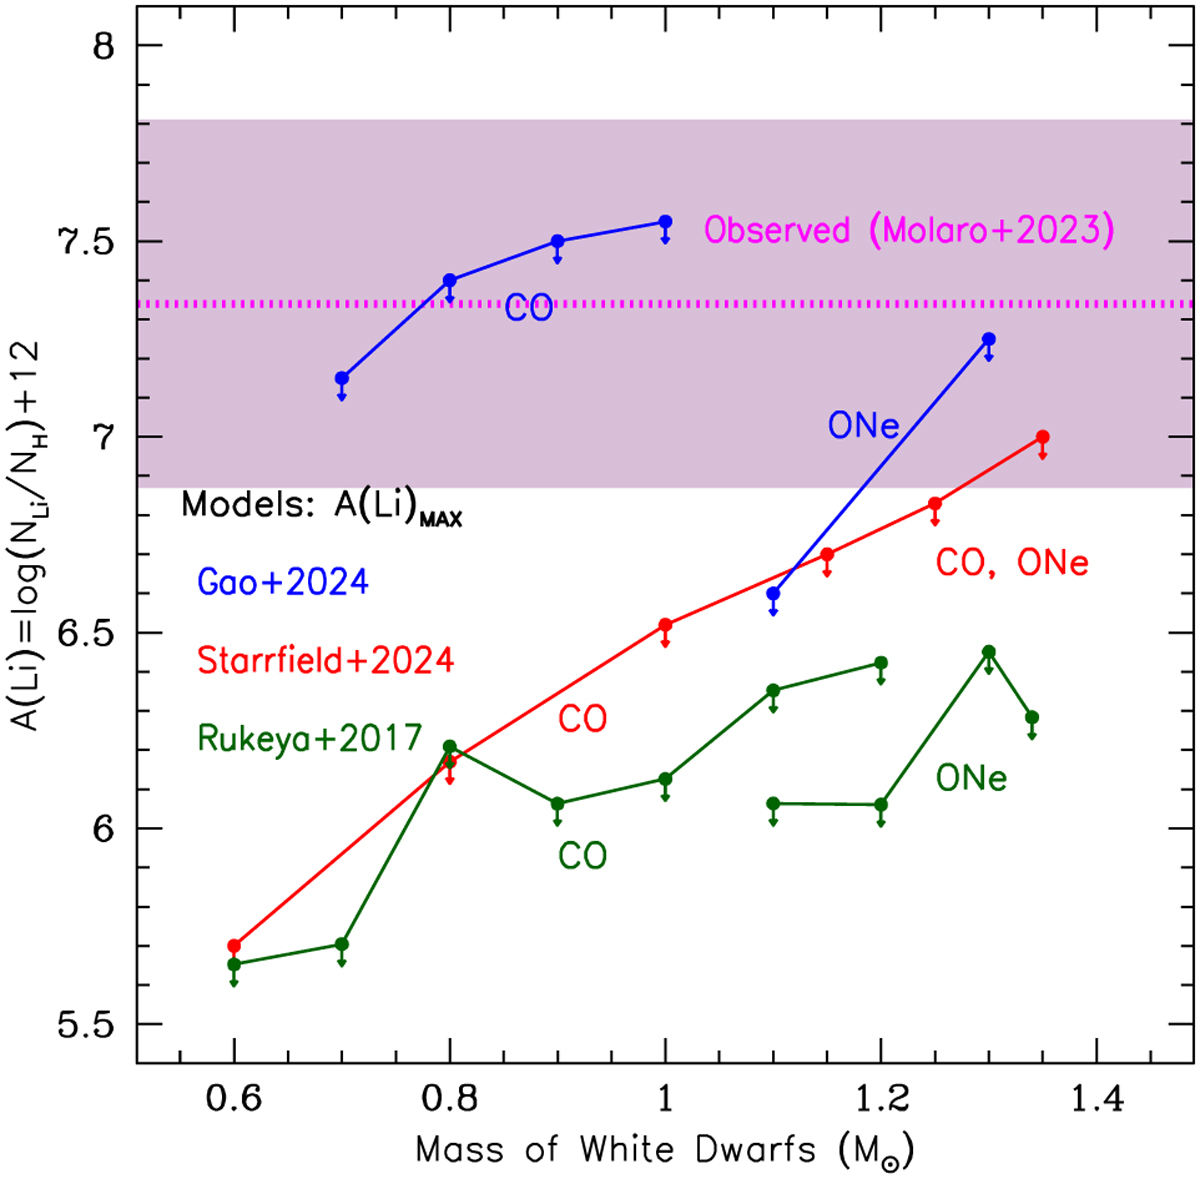
Relative abundances of Li/H in nova explosions. The shaded area shows the range of observed values and the red horizontal line is the average value, as reported in Molaro et al. (2022). Curves represent the highest values found in the calculations of Starrfield et al. (2024, in red), Rukeya et al. (2017, in green) and Gao et al. (2024, in blue), in explosions of CO and ONe white dwarfs of various masses. The results of José et al. (2020) are considerably below the scale of the figure.
Current usage metrics show cumulative count of Article Views (full-text article views including HTML views, PDF and ePub downloads, according to the available data) and Abstracts Views on Vision4Press platform.
Data correspond to usage on the plateform after 2015. The current usage metrics is available 48-96 hours after online publication and is updated daily on week days.
Initial download of the metrics may take a while.