Fig. 1
Download original image
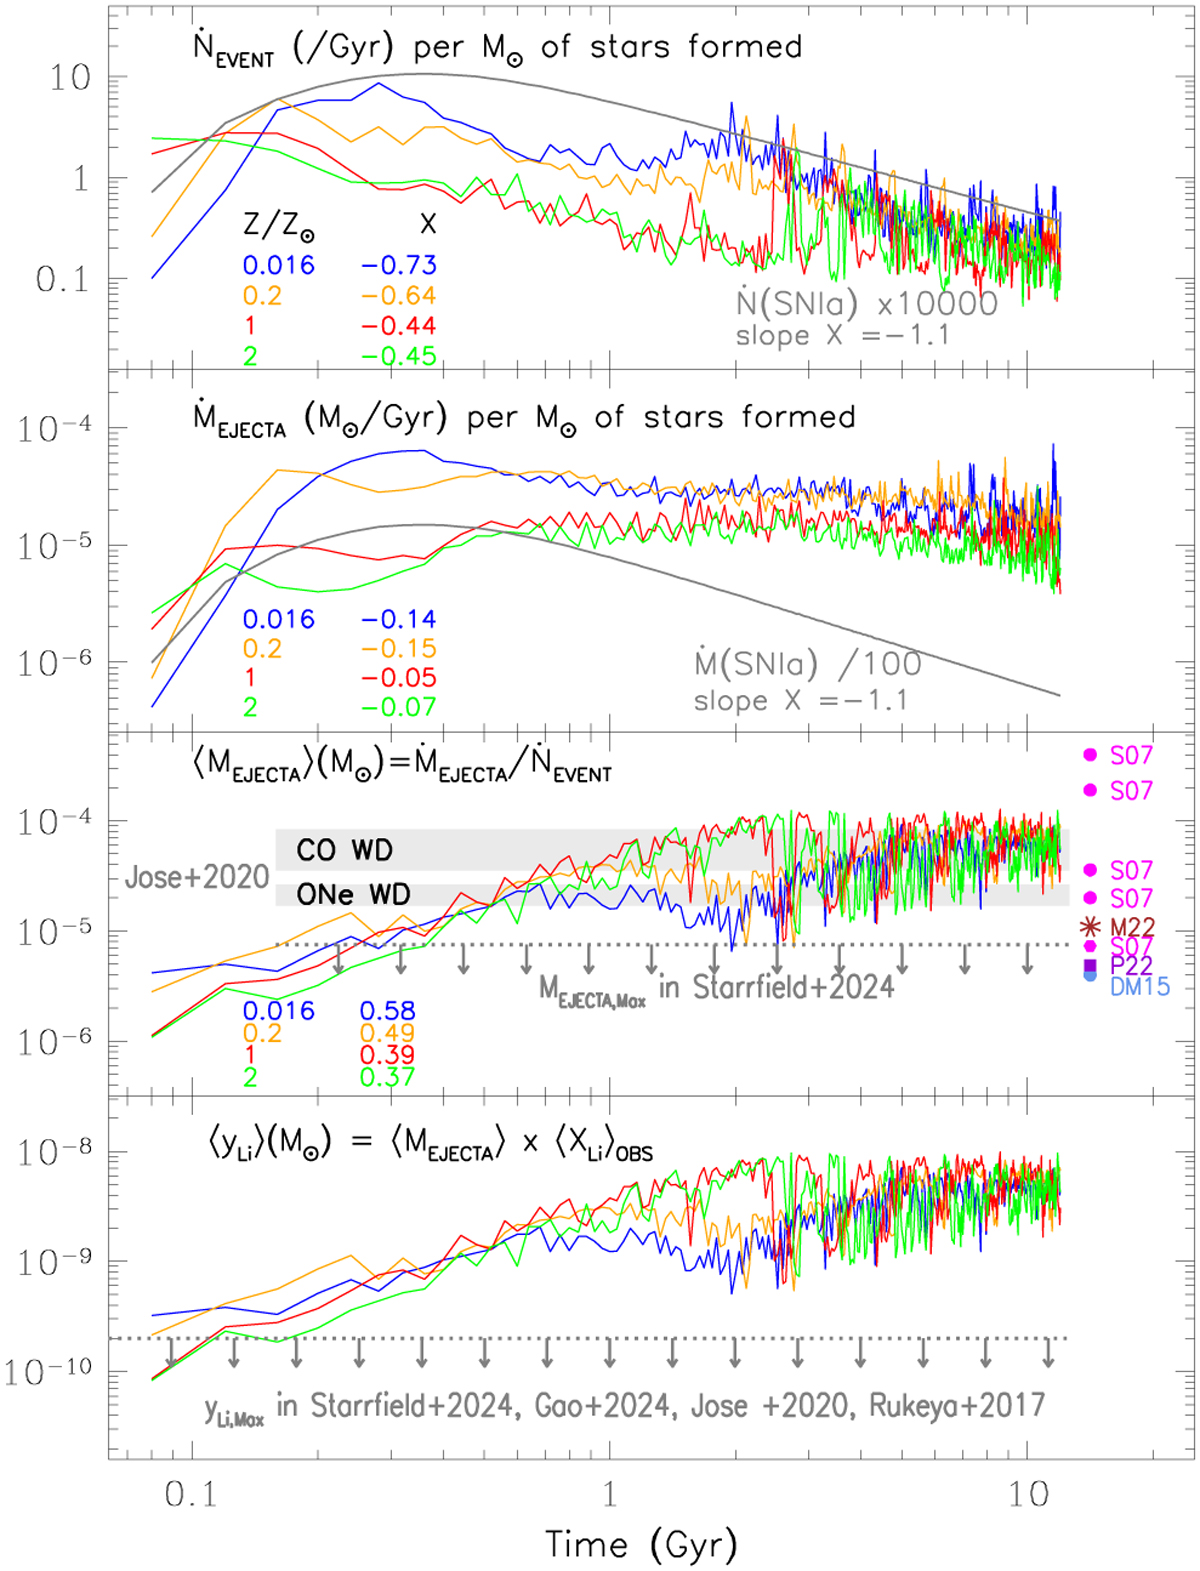
Derived delay time distributionss for novae event rates ![]() (top) and ejecta mass rates
(top) and ejecta mass rates ![]() (second from top) per 1 M⊙ of stars formed and for a few selected metallicities, adopted from Kemp et al. (2022b). The slopes X of power-law fits appear colour-coded for each metallicity. The grey curves display the corresponding DTDs for SN Ia, with a single slope x=-1.1 above t=0.3 Gyr; the SN Ia curves are multiplied by 10 000 in the top panel and divided by 100 in the second panel. Third panel: average ejecta mass of Kemp et al. (2022a) compared to the highest ejecta mass of the models of Starrfield et al. (2024) indicated by upper limits, to hydrodynamical models of José et al. (2020) within grey shaded areas, and to available observations from S07 (Schwarz et al. 2007), M22 (Molaro et al. 2022), P22 (Pandey et al. 2022), and DM15 (Das & Mondal 2015). Bottom panel: average Li yield when assuming the ejecta mass of the third panel and an average Li mass fraction ⟨XLi⟩OBS from observations (see Fig. 2 and text). The grey arrows indicate the highest Li yield obtained in any of the cited studies.
(second from top) per 1 M⊙ of stars formed and for a few selected metallicities, adopted from Kemp et al. (2022b). The slopes X of power-law fits appear colour-coded for each metallicity. The grey curves display the corresponding DTDs for SN Ia, with a single slope x=-1.1 above t=0.3 Gyr; the SN Ia curves are multiplied by 10 000 in the top panel and divided by 100 in the second panel. Third panel: average ejecta mass of Kemp et al. (2022a) compared to the highest ejecta mass of the models of Starrfield et al. (2024) indicated by upper limits, to hydrodynamical models of José et al. (2020) within grey shaded areas, and to available observations from S07 (Schwarz et al. 2007), M22 (Molaro et al. 2022), P22 (Pandey et al. 2022), and DM15 (Das & Mondal 2015). Bottom panel: average Li yield when assuming the ejecta mass of the third panel and an average Li mass fraction ⟨XLi⟩OBS from observations (see Fig. 2 and text). The grey arrows indicate the highest Li yield obtained in any of the cited studies.
Current usage metrics show cumulative count of Article Views (full-text article views including HTML views, PDF and ePub downloads, according to the available data) and Abstracts Views on Vision4Press platform.
Data correspond to usage on the plateform after 2015. The current usage metrics is available 48-96 hours after online publication and is updated daily on week days.
Initial download of the metrics may take a while.