Fig. 7.
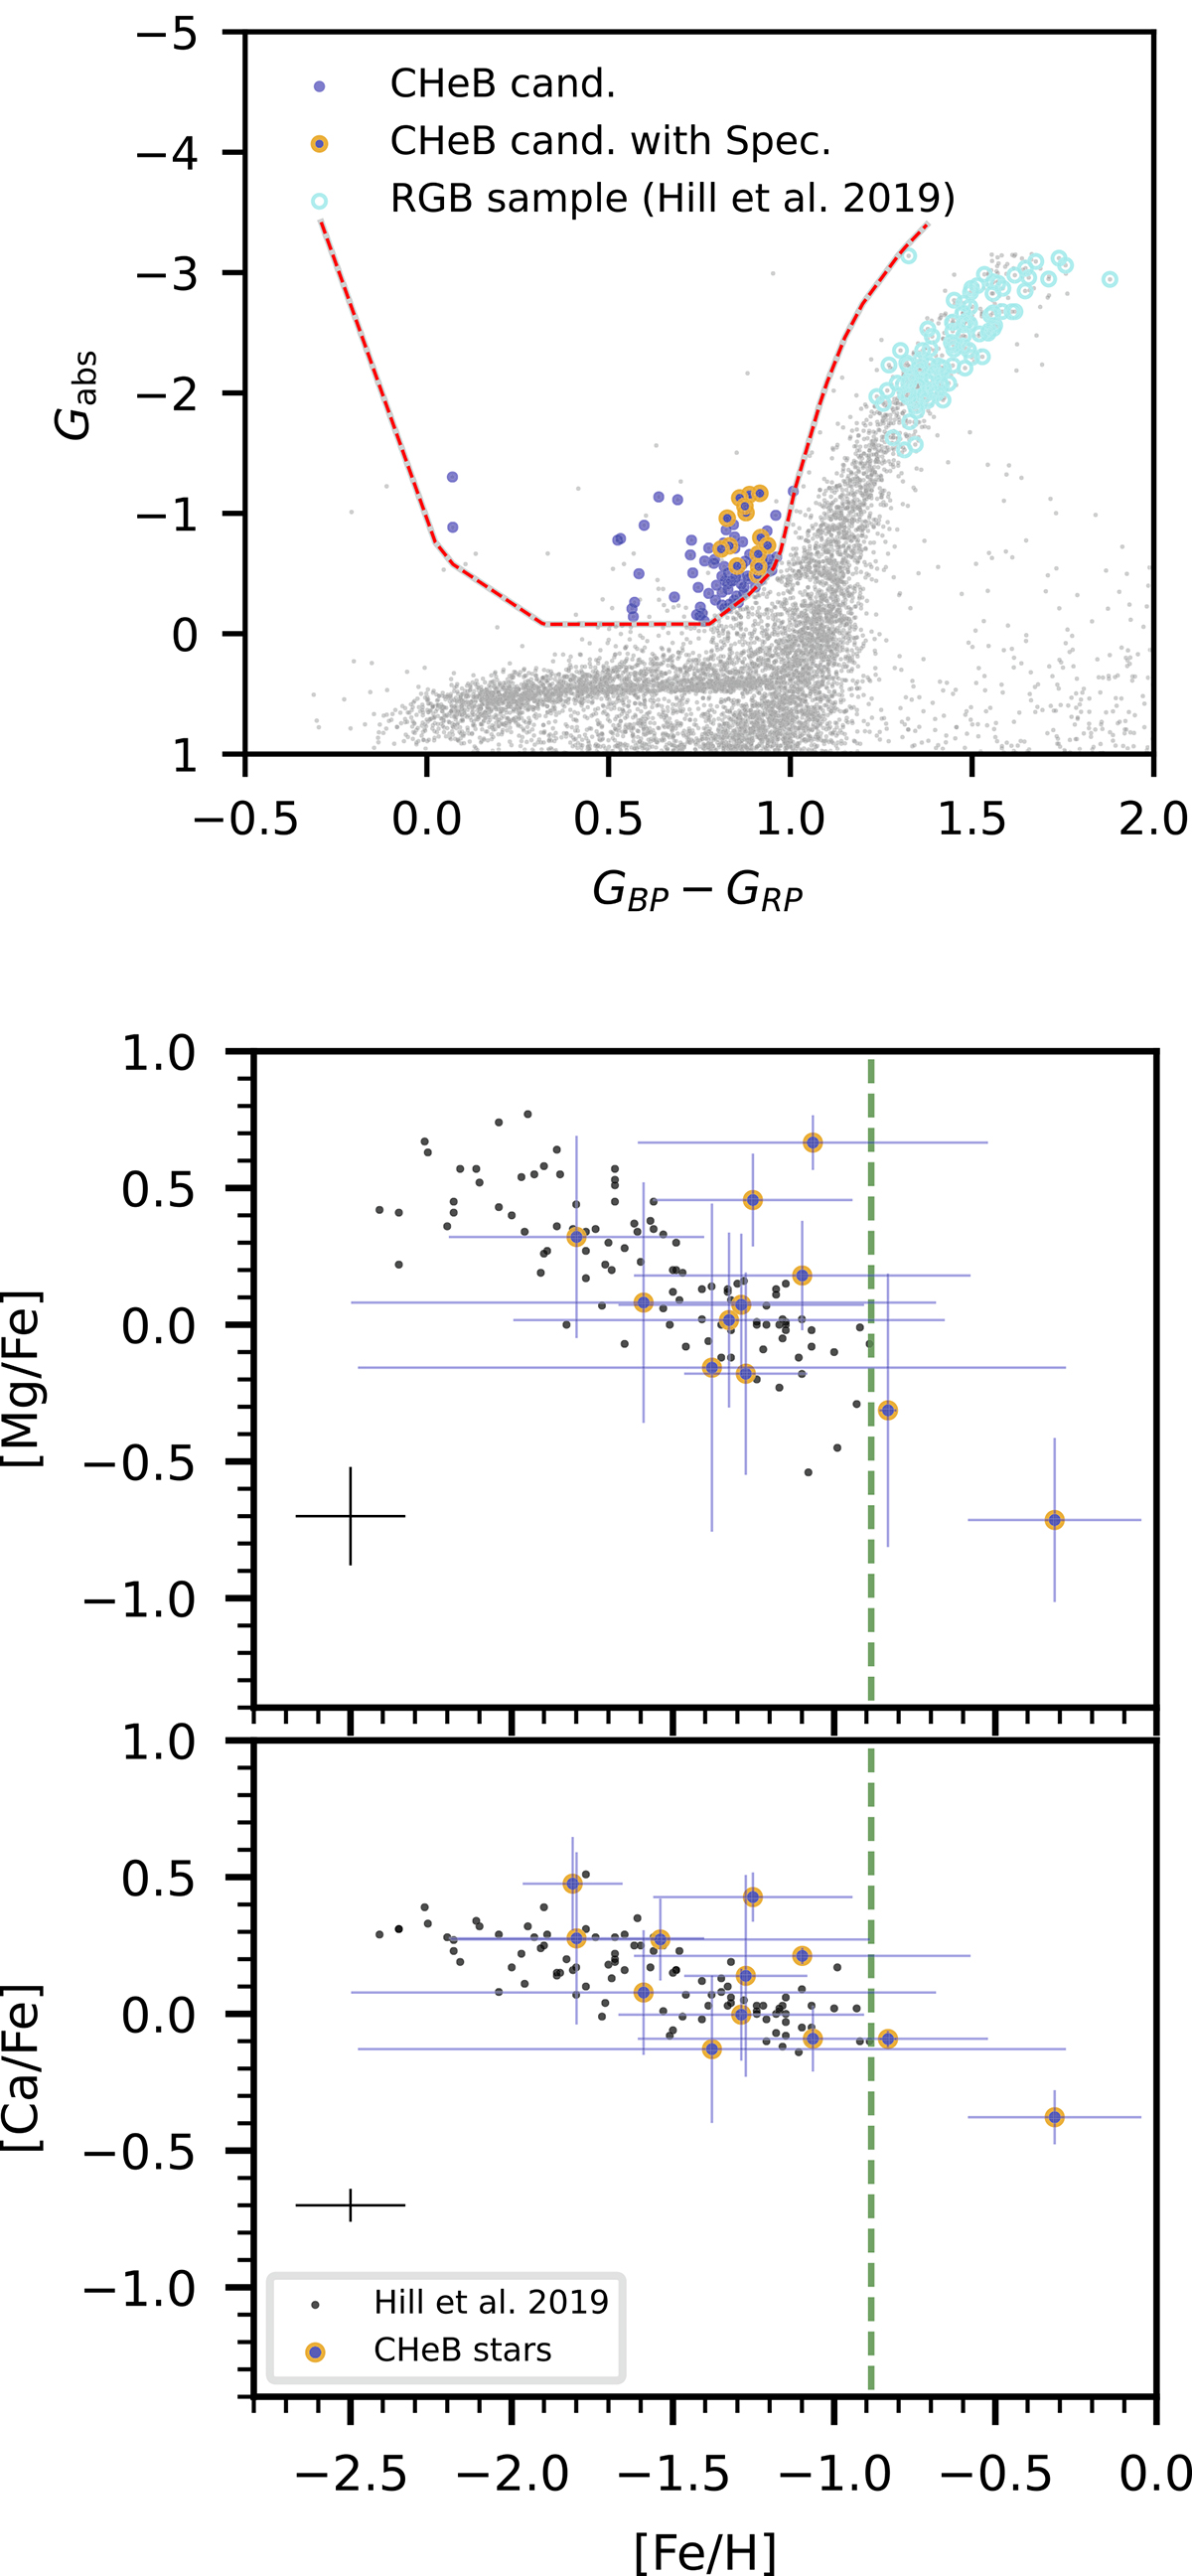
Download original image
CMD of Sculptor showing different samples (top). Blue dots for the CHeB candidates; blue dots with orange circle for the CHeB candidates with Giraffe spectra with S/N ≥ 20; open cyan circles for the RGB sample from Hill et al. (2019). The gray dots and the red dashed line have the same meanings as in Figure 4. Middle and bottom panels give a comparison of the measured metallicities for the CHeB candidates with those of RGB stars measured by Hill et al. (2019, small black dots). The typical error bars of different elements for the RGB stars are plotted in black on the lower-left of each panel, respectively. In these panels, the green dashed line indicates the upper limit of [Fe/H] for the RGB sample.
Current usage metrics show cumulative count of Article Views (full-text article views including HTML views, PDF and ePub downloads, according to the available data) and Abstracts Views on Vision4Press platform.
Data correspond to usage on the plateform after 2015. The current usage metrics is available 48-96 hours after online publication and is updated daily on week days.
Initial download of the metrics may take a while.