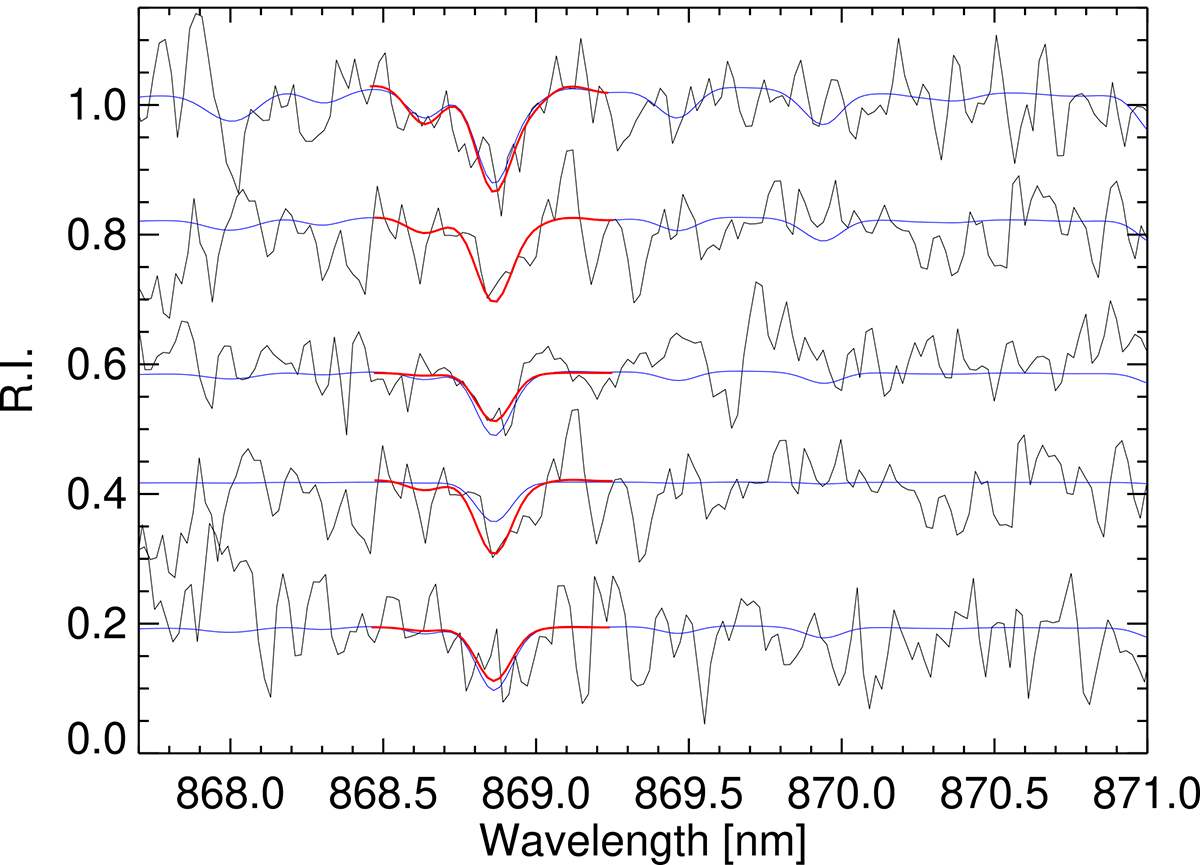
Fig. 6.
Download original image
Observed spectra (solid black) normalised and vertically shifted for presentation purpose, compared to synthetic spectra (solid blue) in the wavelength range of the 868.86 nm Fe I line and the best fit of the Fe feature (solid red). The spectra are ordered in decreasing metallicity, from top (the most metal-rich) to bottom (the most metal-poor): Scl 12, Scl 19, Scl 9, Scl 29, and Scl 2.
Current usage metrics show cumulative count of Article Views (full-text article views including HTML views, PDF and ePub downloads, according to the available data) and Abstracts Views on Vision4Press platform.
Data correspond to usage on the plateform after 2015. The current usage metrics is available 48-96 hours after online publication and is updated daily on week days.
Initial download of the metrics may take a while.