Fig. 4.
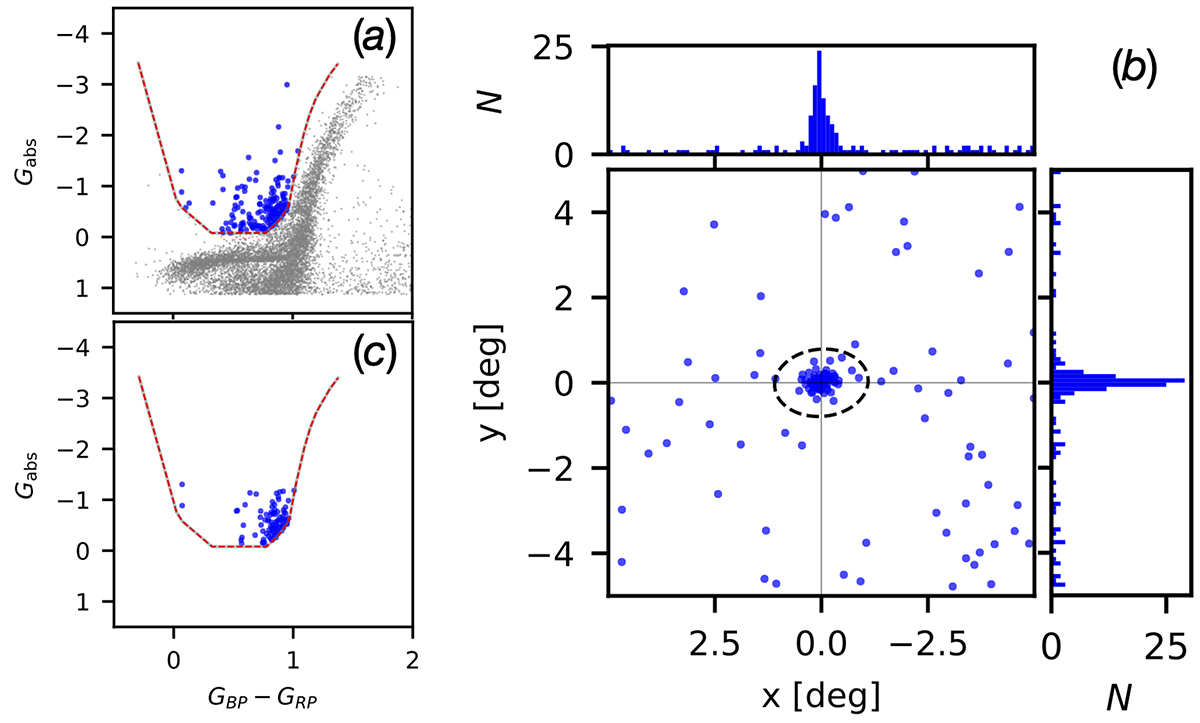
Download original image
Selection of CHeB candidates and their spatial distribution. Panel a: a rough CMD selection of CHeB candidates (blue dots) in the full field of 5 × 5 sq. deg. The PM-selected sample in the same field is plotted in gray dots. Panel b: the spatial distribution of the rough CHeB candidates, with histograms of counts projection on each axis for showing the significant concentration of the CHeB candidates at the Sculptor’s center. Panel c shows only the CHeB candidates that are selected by their locations in the CMD, spatial location within the elliptical radius of 1.1 deg. The red dashed line in both panels a and c is the CHeB selection condition (see Figure 3 and Sect. 3.3.1).
Current usage metrics show cumulative count of Article Views (full-text article views including HTML views, PDF and ePub downloads, according to the available data) and Abstracts Views on Vision4Press platform.
Data correspond to usage on the plateform after 2015. The current usage metrics is available 48-96 hours after online publication and is updated daily on week days.
Initial download of the metrics may take a while.