Fig. 8.
Download original image
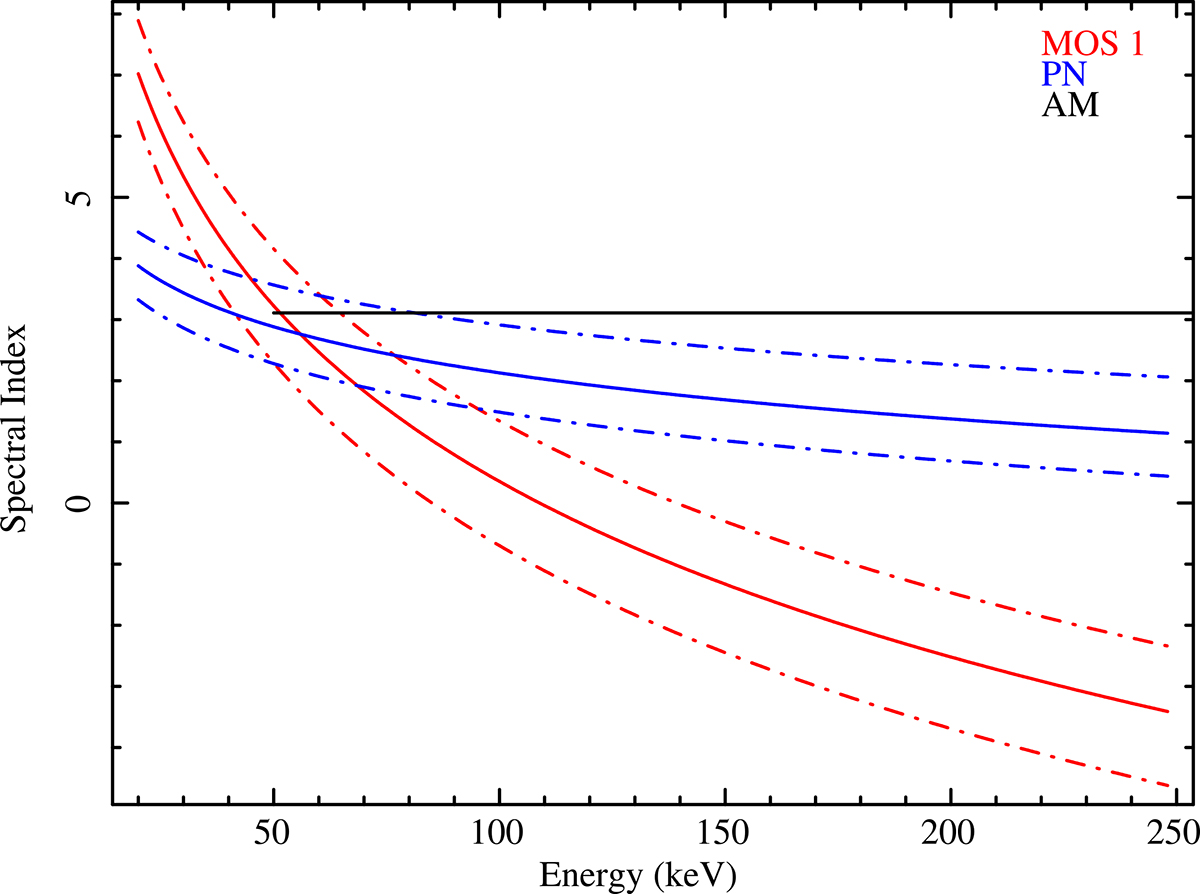
Spectral index computed with Eq. (2) for MOS1 (continuous blue line) and PN (continuous red line) spectra of observation ID 0110980601. The dash-dotted lines indicate the 90% confidence level. For comparison, the spectral index relative to the 90% flux in the active magnetosphere given in Lotti et al. (2018) is indicated with the black line.
Current usage metrics show cumulative count of Article Views (full-text article views including HTML views, PDF and ePub downloads, according to the available data) and Abstracts Views on Vision4Press platform.
Data correspond to usage on the plateform after 2015. The current usage metrics is available 48-96 hours after online publication and is updated daily on week days.
Initial download of the metrics may take a while.