Fig. 5.
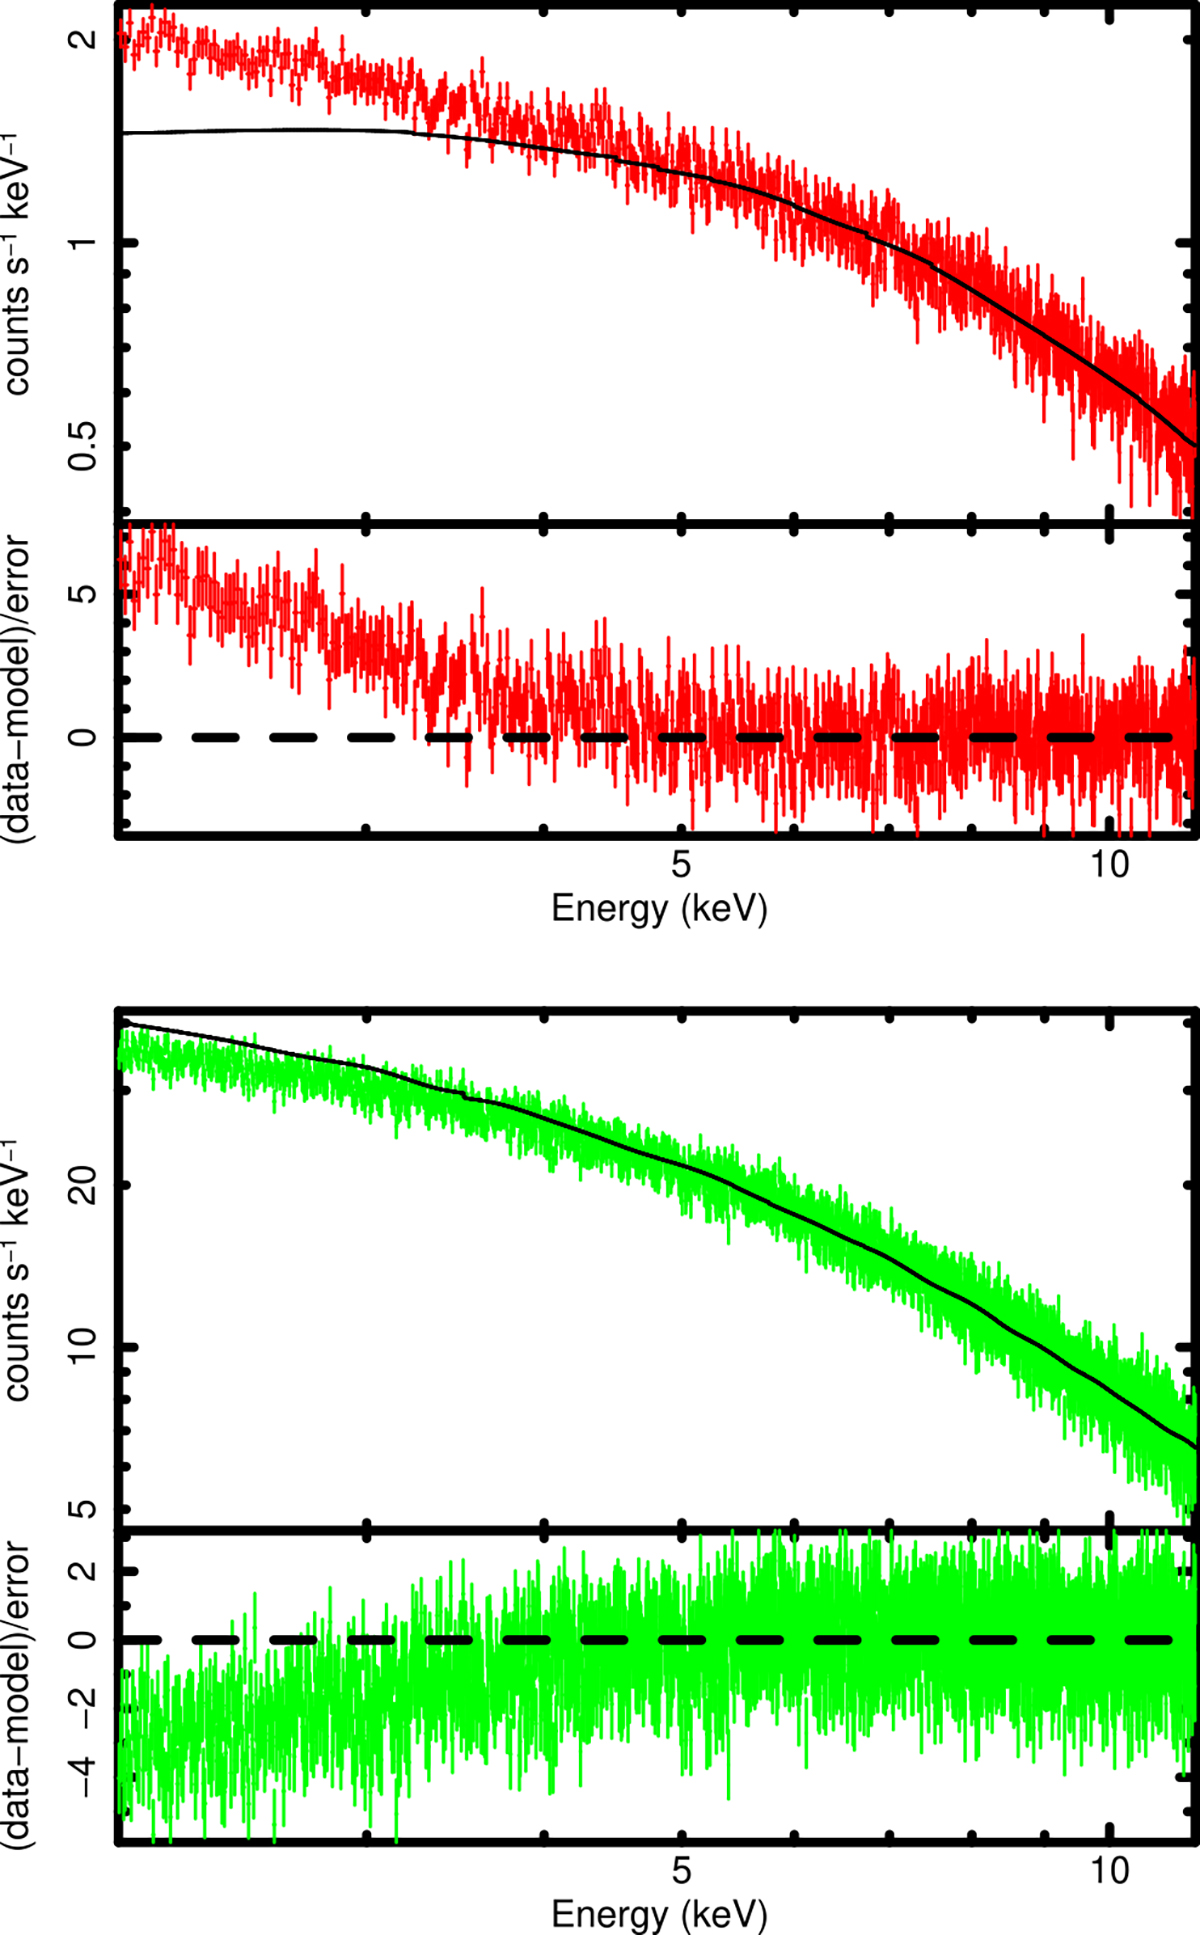
Download original image
Spectral fit with a power law. The upper plot shows the MOS1 spectrum relative to observation ID 0108060601. The top panel presents with a continuous line the 5–11 keV best-fit power law extrapolated down to 2 keV, while residuals over the whole range are presented in the lower panel. The lower plot is relative to the same figure for the 0852190101 PN spectrum.
Current usage metrics show cumulative count of Article Views (full-text article views including HTML views, PDF and ePub downloads, according to the available data) and Abstracts Views on Vision4Press platform.
Data correspond to usage on the plateform after 2015. The current usage metrics is available 48-96 hours after online publication and is updated daily on week days.
Initial download of the metrics may take a while.