Open Access
Fig. 3.
Download original image
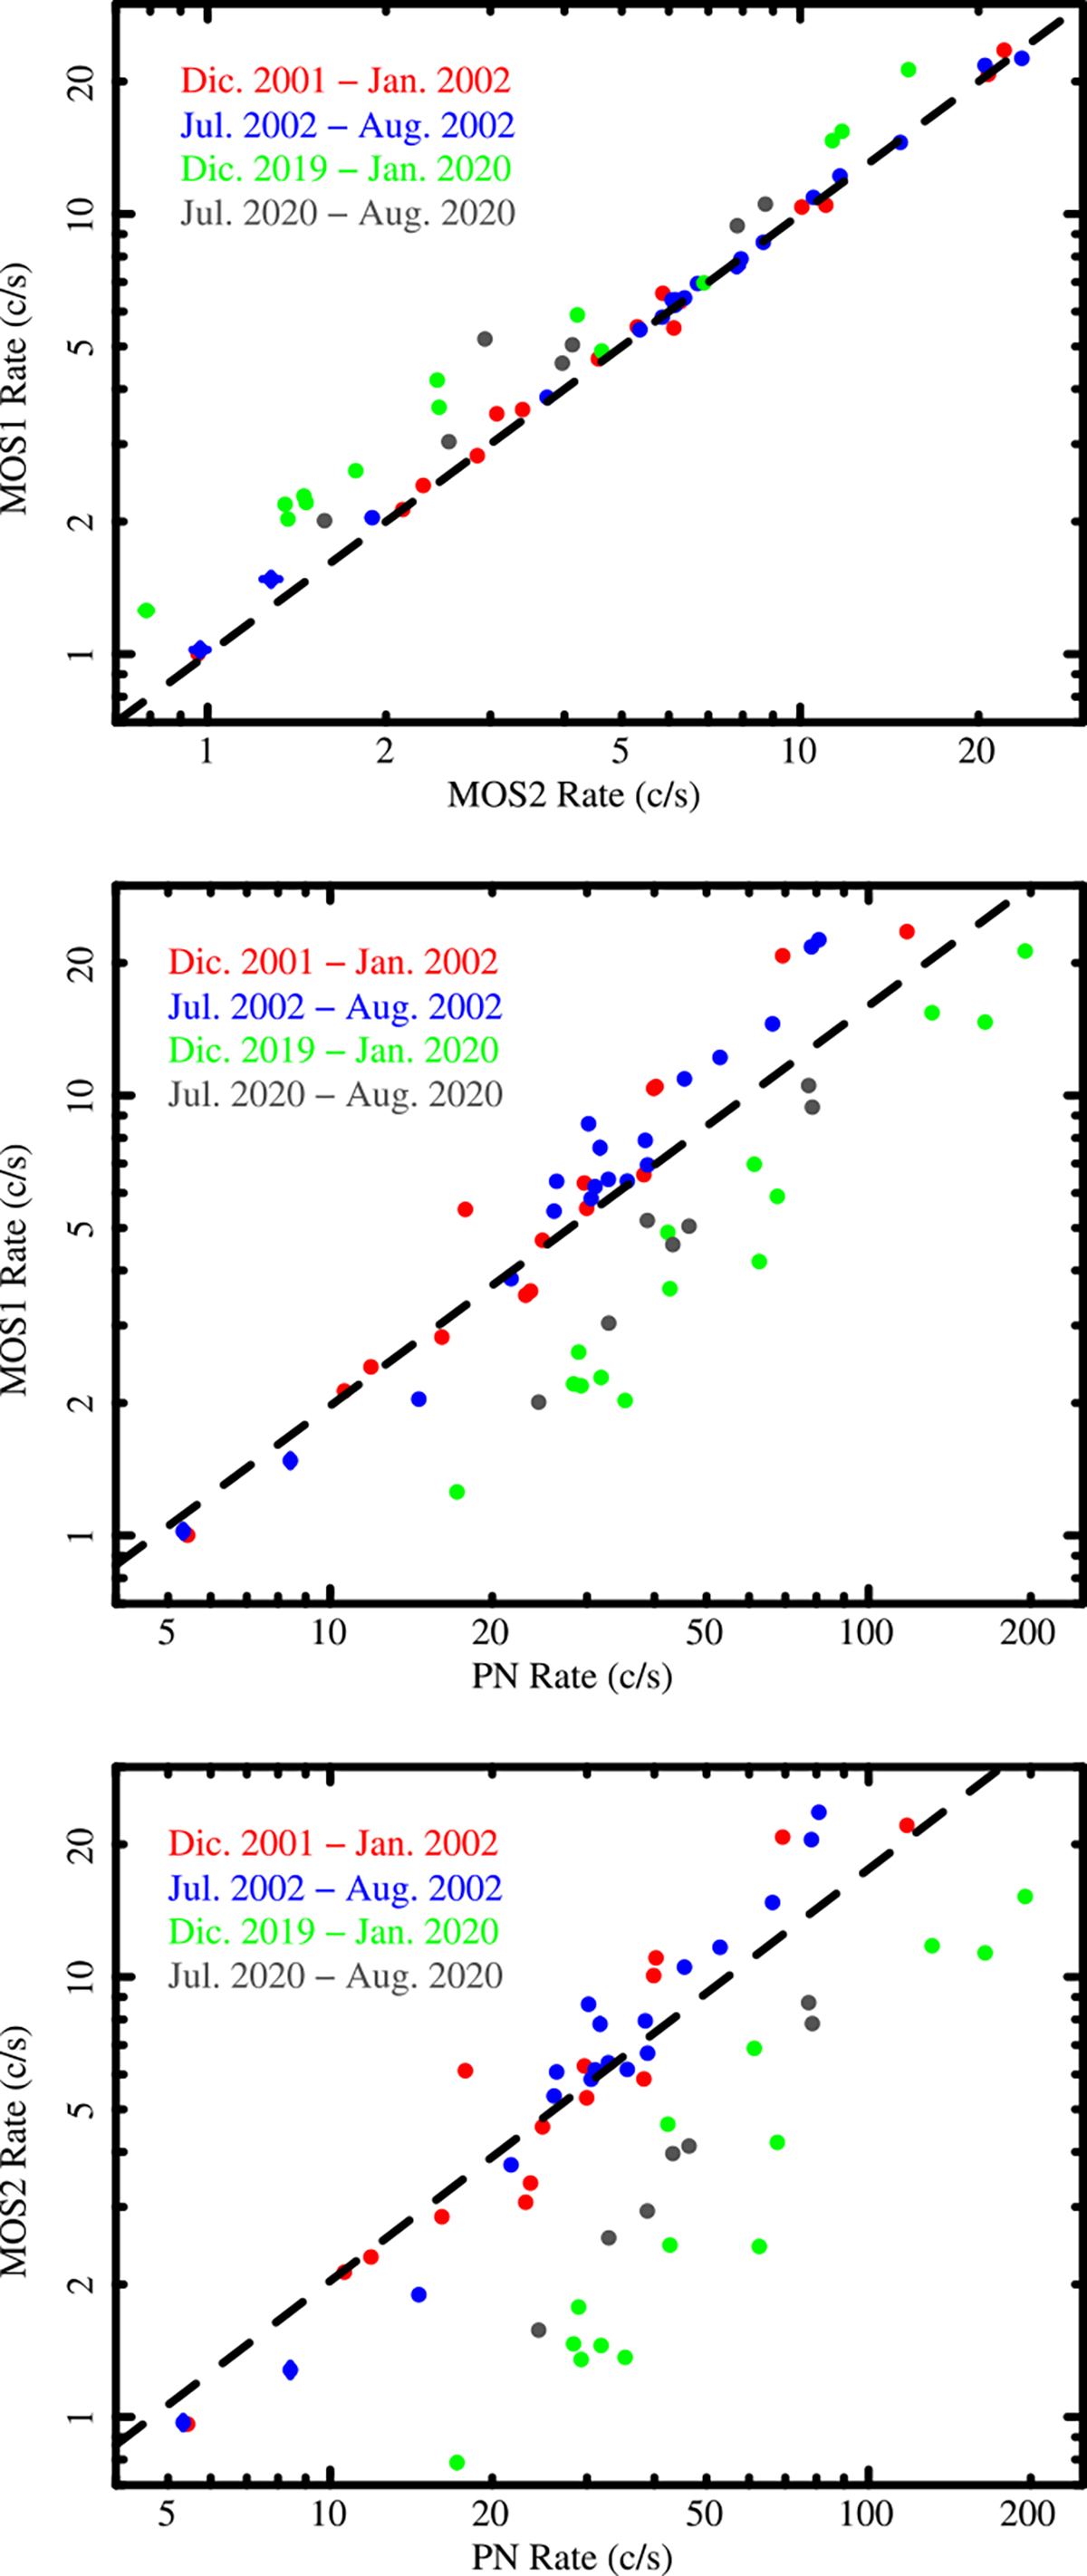
Correlations between rates detected by the three instruments in the four epochs. Colors indicate epochs (see text). The superimposed dashed black line is relative to the best fit of epoch B. The top panel is relative to MOS1 vs. MOS2 rates, the middle panel to MOS1 vs. PN, and the bottom panel to MOS2 vs. PN.
Current usage metrics show cumulative count of Article Views (full-text article views including HTML views, PDF and ePub downloads, according to the available data) and Abstracts Views on Vision4Press platform.
Data correspond to usage on the plateform after 2015. The current usage metrics is available 48-96 hours after online publication and is updated daily on week days.
Initial download of the metrics may take a while.