Open Access
Fig. 2.
Download original image
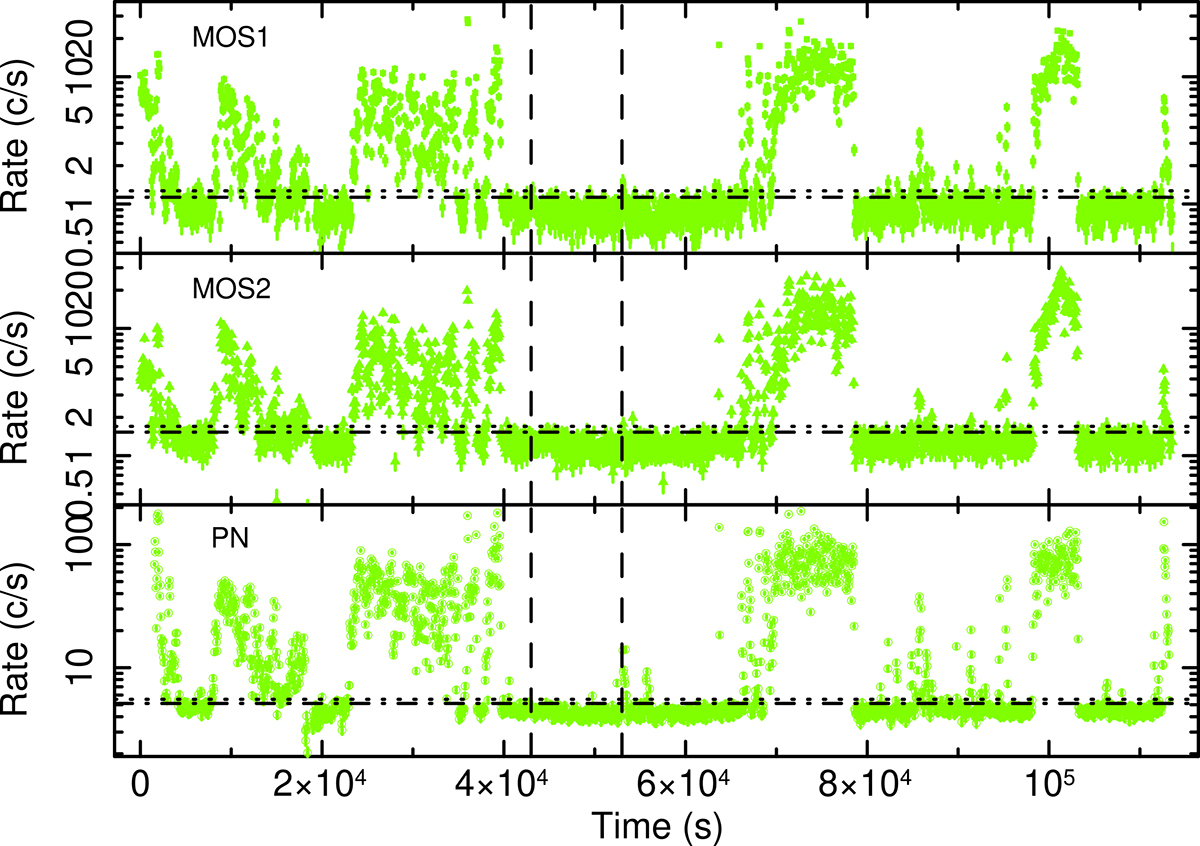
Light curves relative to observation ID 0844860601 (2020-01-06) for MOS1, MOS2, and PN. The dashed vertical lines delimit the interval in which the background rate was evaluated, the dash-dotted lines indicate the highest background rate, and the dotted lines indicate the lowest flare rate.
Current usage metrics show cumulative count of Article Views (full-text article views including HTML views, PDF and ePub downloads, according to the available data) and Abstracts Views on Vision4Press platform.
Data correspond to usage on the plateform after 2015. The current usage metrics is available 48-96 hours after online publication and is updated daily on week days.
Initial download of the metrics may take a while.