Fig. 10.
Download original image
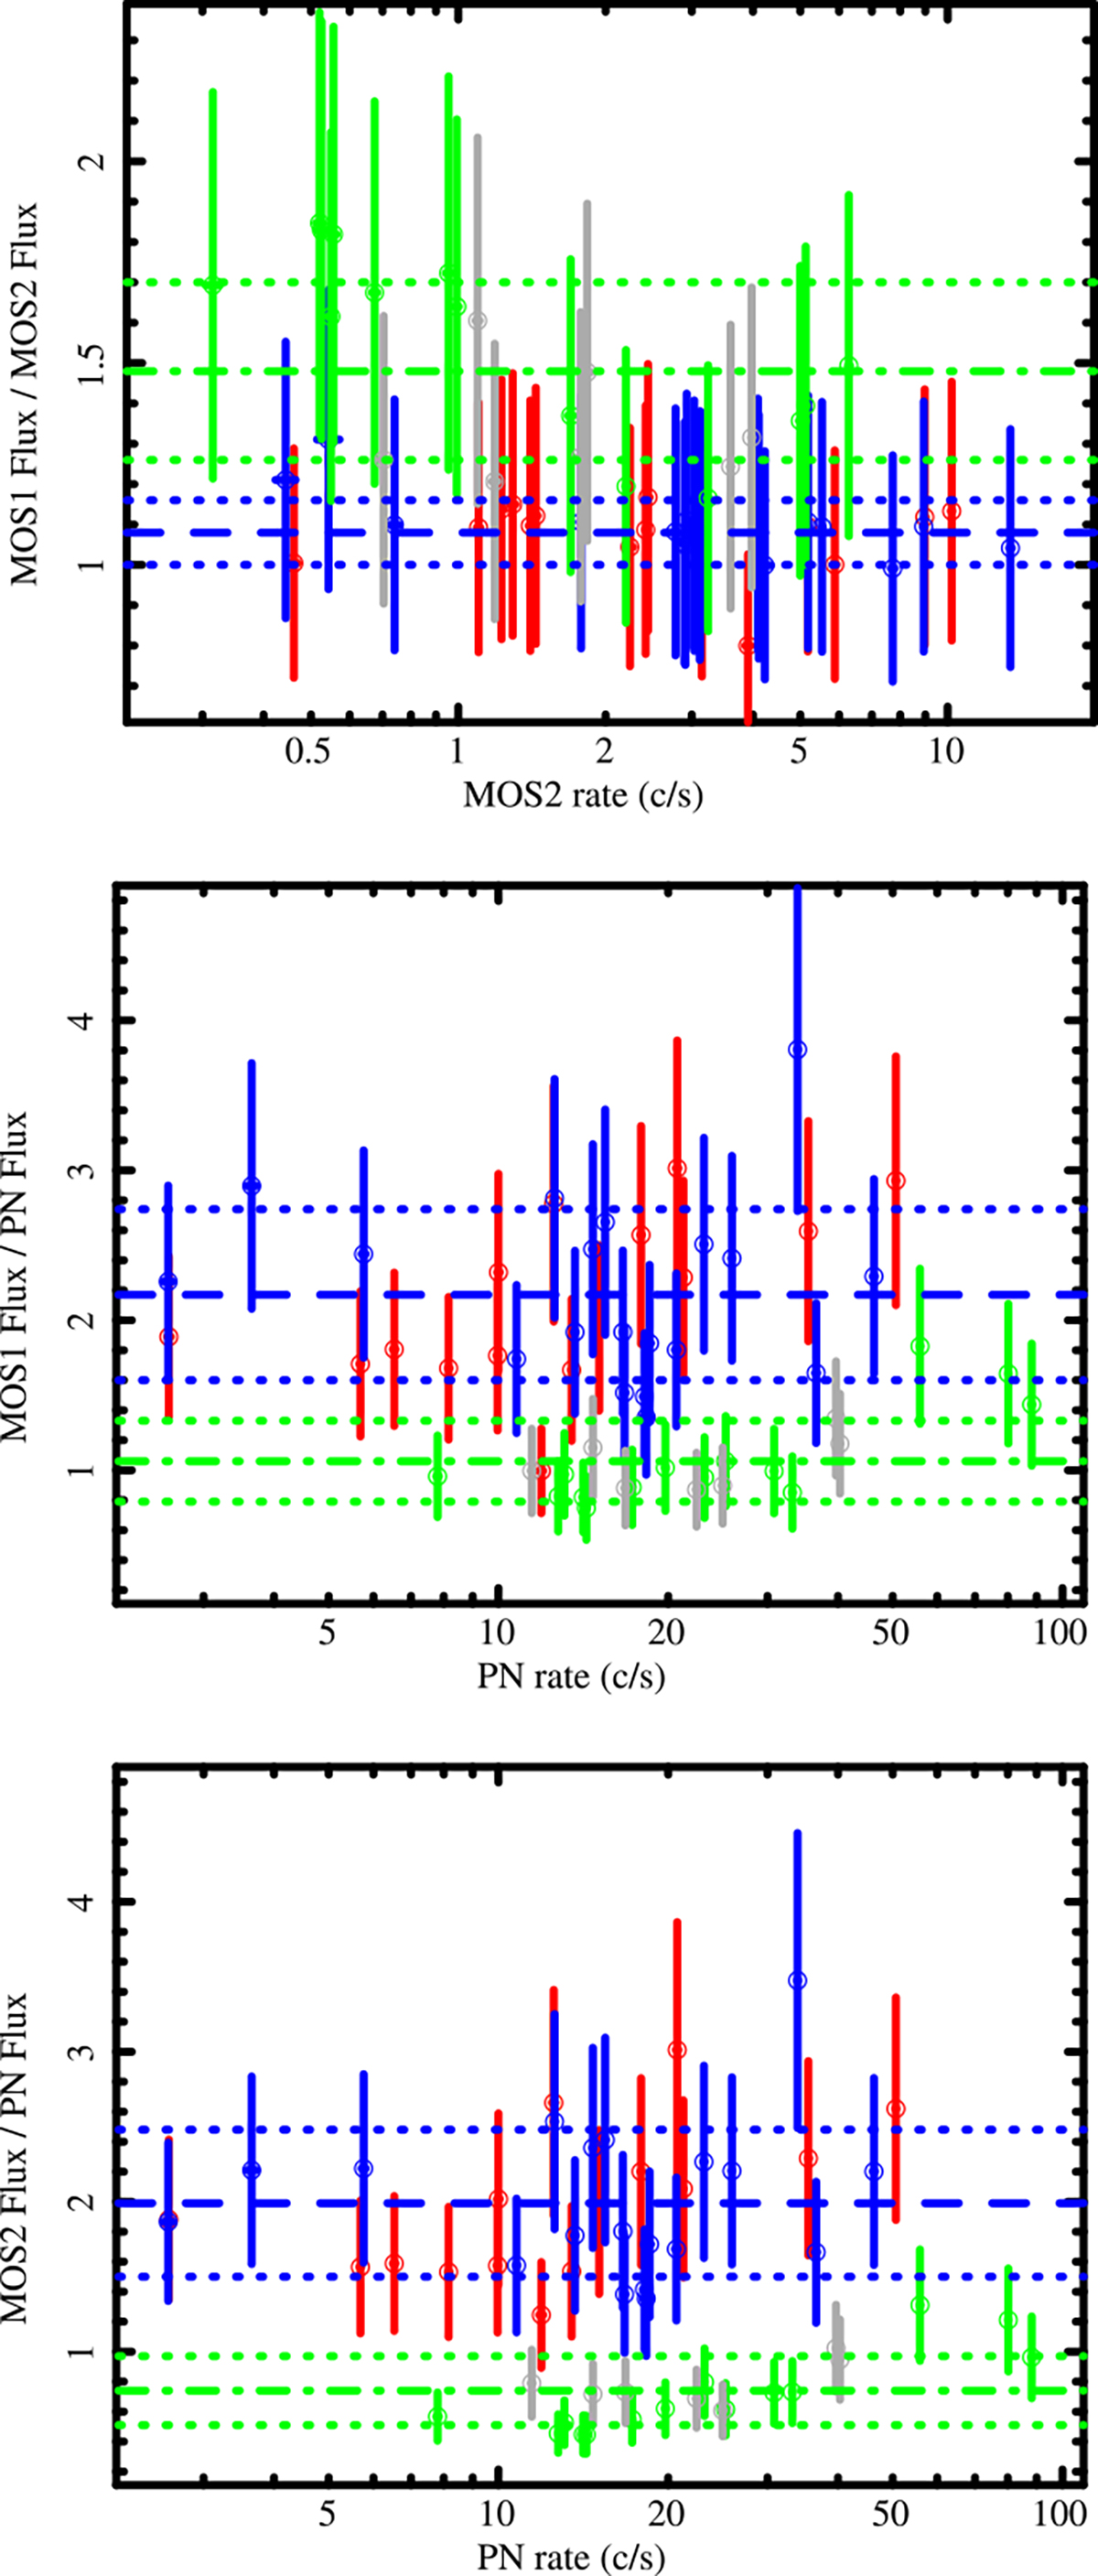
Ratio of the 30–300 proton input flux measured by MOS2 and by PN as a function of the PN rates in the same band. The dashed blue line is the average value for the interval A and B, while the dash-dotted green line is the average for C and D. The dotted lines indicate the error ranges. Colors on the points are relative to the four epochs: epoch A in red, epoch B in blue, epoch C in green, and epoch D in gray.
Current usage metrics show cumulative count of Article Views (full-text article views including HTML views, PDF and ePub downloads, according to the available data) and Abstracts Views on Vision4Press platform.
Data correspond to usage on the plateform after 2015. The current usage metrics is available 48-96 hours after online publication and is updated daily on week days.
Initial download of the metrics may take a while.