Fig. 9
Download original image
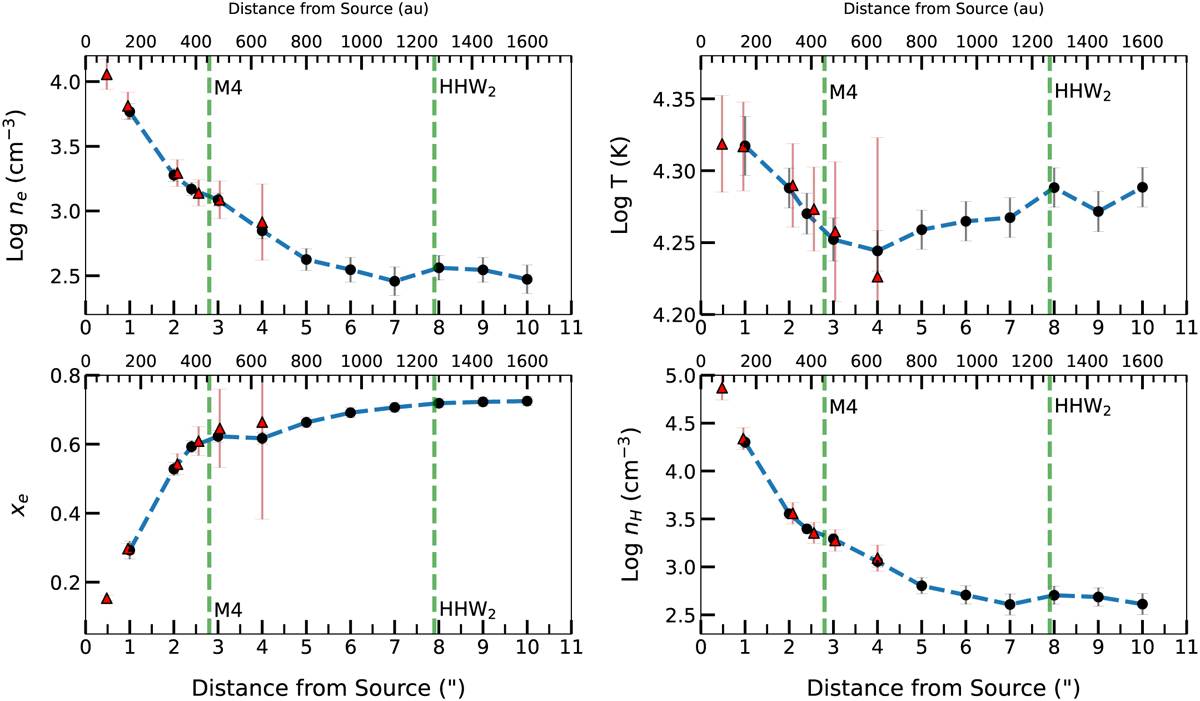
Results of the BE analysis from spectra sampled along the red-shifted jet axis. Clockwise from top left, the plots show electron density, ne, electron temperature, Te, hydrogen density, nH (= ne/xe), and ionisation fraction, xe. Results from the MUSE data are shown as black circles with the results from the X-shooter data shown as red triangles, and approximate knot positions are shown as green dashed lines. The ne, Te, and nH values are plotted on a log scale. Error bars are derived from the flux calibration uncertainty as described in Sect. 4.3.2.
Current usage metrics show cumulative count of Article Views (full-text article views including HTML views, PDF and ePub downloads, according to the available data) and Abstracts Views on Vision4Press platform.
Data correspond to usage on the plateform after 2015. The current usage metrics is available 48-96 hours after online publication and is updated daily on week days.
Initial download of the metrics may take a while.