Fig. 8
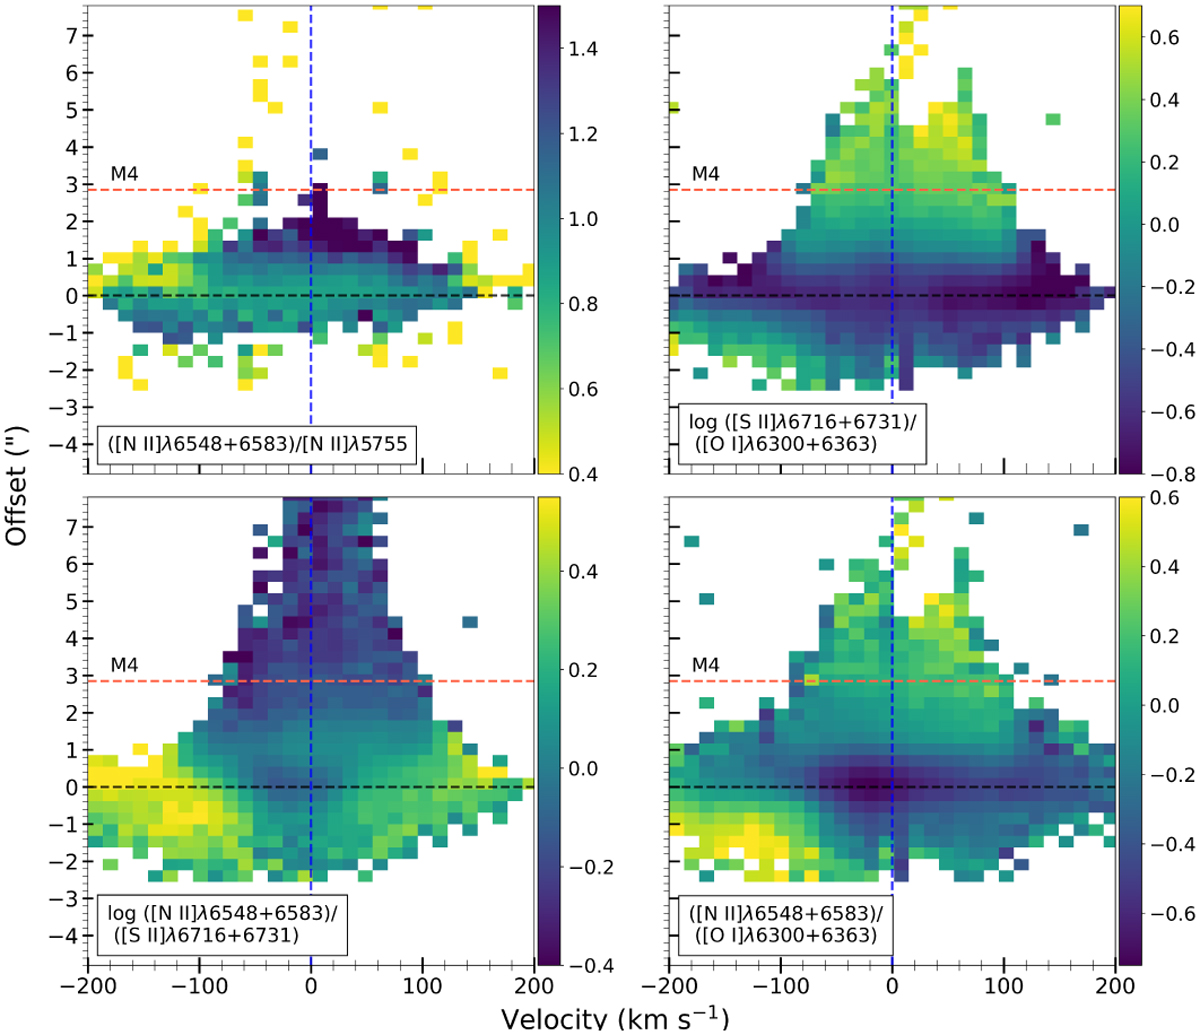
Download original image
Position-velocity maps obtained from the X-shooter data as in Fig. 6, for line ratios tracing Te and xe. The PV maps for each line ratio are dereddened along the jet axis and binned along both axes by a factor of 2. We note the high-excitation region observed at <−100 km s−1 in the blue-shifted lobe (lower left within each panel) which likely represents the base of the blue-shifted jet. Panel a. [N II]λ(6548+65 83)/5755 tracing electron temperature Te; panel b. [S II]λ(6716+6731)/[O I]λ(6300+6363) tracing Te and ionisation fraction xe; panel c, [N II]λ(6548+6583)/[S II]λ(6716+6731) tracing xe, ne and Te and panel d, [N II]λ(6548+6583)/[O I]λ(6300+6363) tracing xe and Te.
Current usage metrics show cumulative count of Article Views (full-text article views including HTML views, PDF and ePub downloads, according to the available data) and Abstracts Views on Vision4Press platform.
Data correspond to usage on the plateform after 2015. The current usage metrics is available 48-96 hours after online publication and is updated daily on week days.
Initial download of the metrics may take a while.