Fig. 7
Download original image
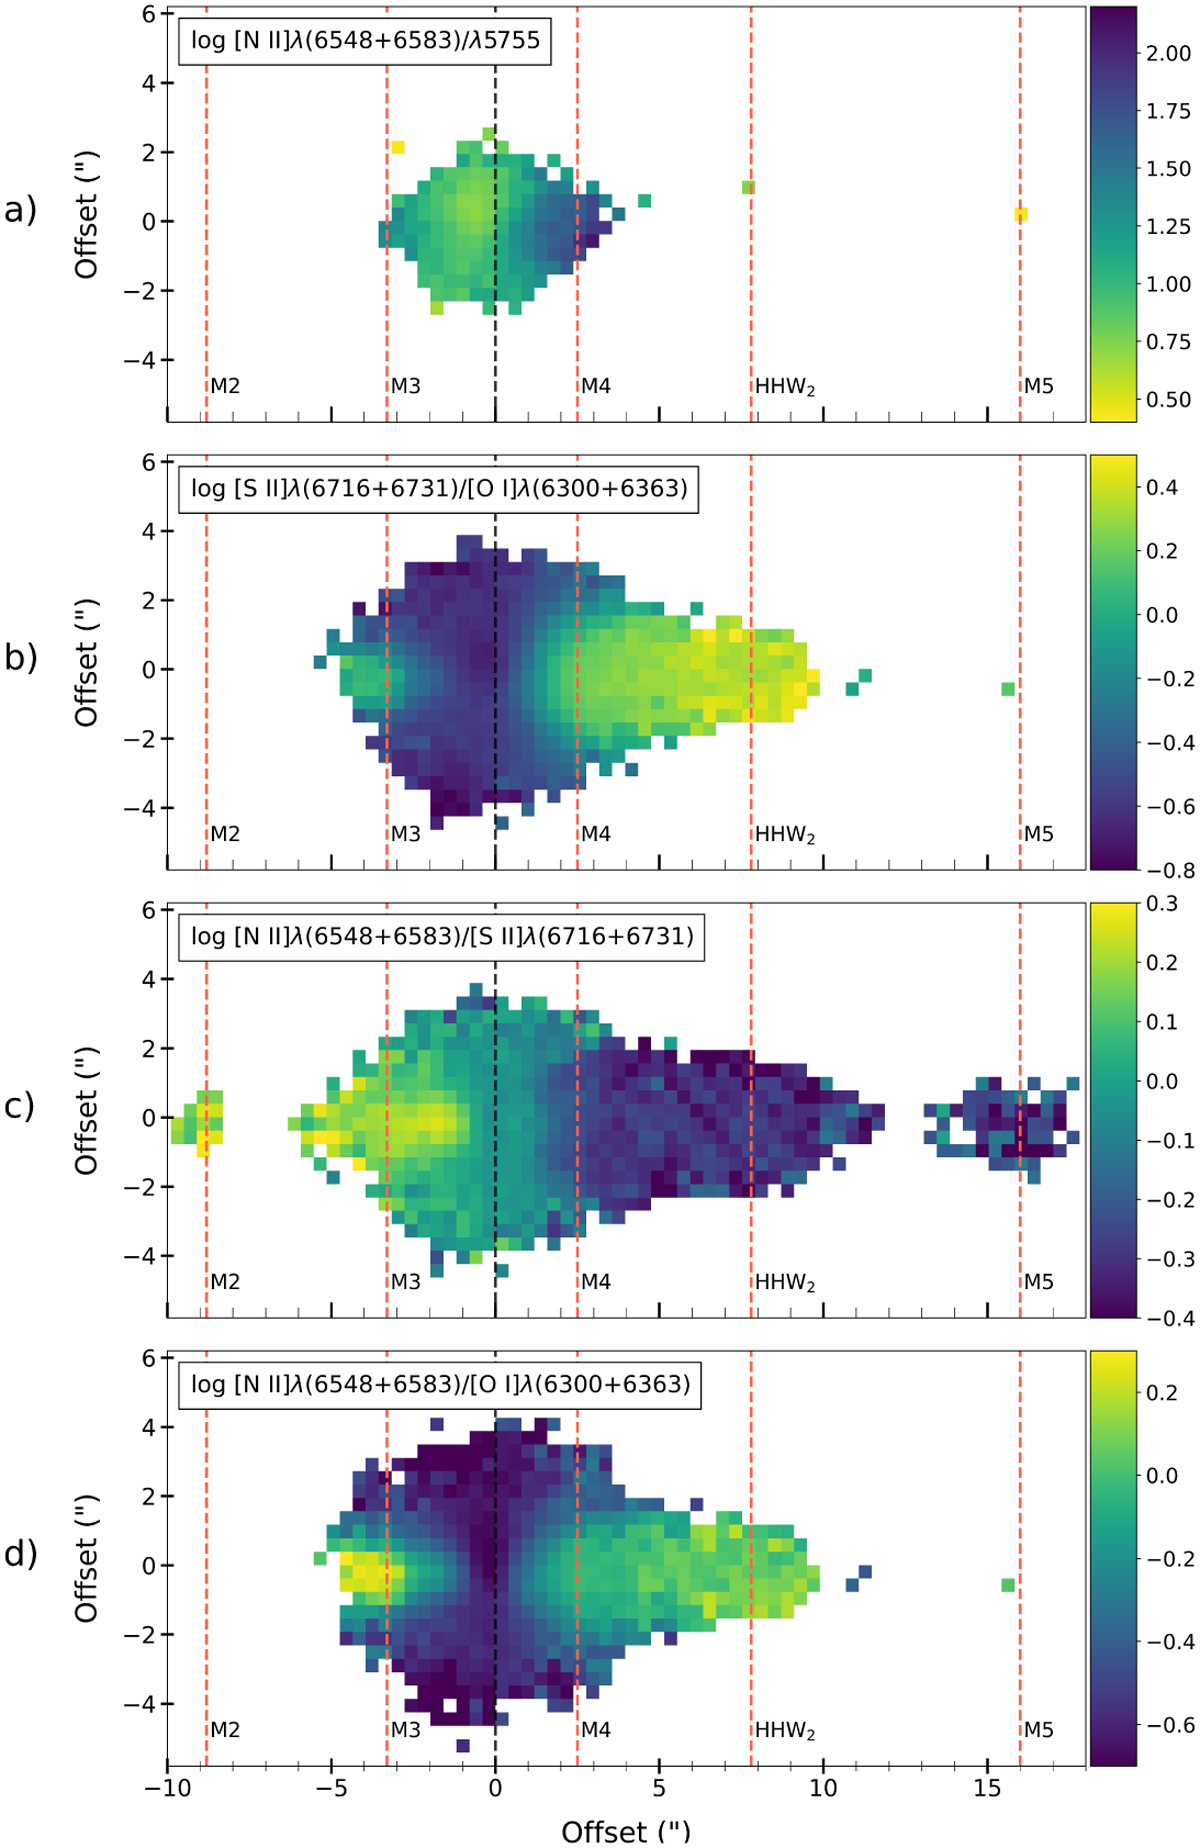
Maps from the MUSE data as in Fig. 5, for line ratios tracing Te and xe to show regions of higher excitation. Panel a, [N II]λ(6548+6583)/5755 tracing electron temperature Te; panel b, [S II]λ(6716+6731)/[O I]λ(6300+6363) tracing Te and ionisation fraction xe; panel c, [N II]λ(6548+6583)/[S II]λ(6716+6731) tracing xe, ne and Te and panel d, [N II]λ(6548+6583)/[O I]λ(6300+6363) tracing xe and Te.
Current usage metrics show cumulative count of Article Views (full-text article views including HTML views, PDF and ePub downloads, according to the available data) and Abstracts Views on Vision4Press platform.
Data correspond to usage on the plateform after 2015. The current usage metrics is available 48-96 hours after online publication and is updated daily on week days.
Initial download of the metrics may take a while.